Battle of the Trend Following Indexes: July 2025
In the Battle of the Trend Following Indexes, we present a monthly update on some of the most respected trend-following benchmarks.
July 2025 Result
Marginal gains, modest losses, and one index still standing apart.
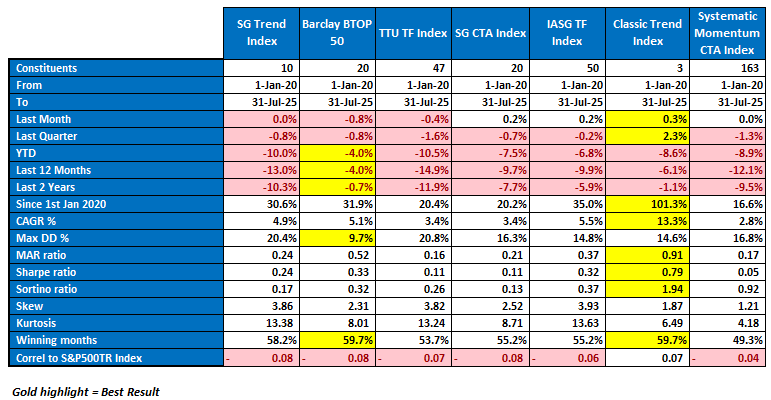
July delivered a mixed set of outcomes. Four of the seven indexes managed to scrape into positive territory, though gains were only marginal. Classic Trend Index led with a +0.3% return, while SG CTA and IASG each added +0.2%, and SG Trend was flat. On the downside, TTU slipped −0.4%, BTOP50 dropped −0.8%, and Systematic Momentum finished flat-to-negative at 0.0%.
The real story remains the long arc. Classic Trend Index has now more than doubled since January 2020 (+101.3%), running a 13.3% CAGR and leading every risk-adjusted measure. The rest of the field remains tightly clustered between +16% and +36% over the same span.
YTD numbers stay firmly negative across the board, from −4.0% for BTOP50 to around −10% for SG Trend and TTU. The drawdown profile is equally telling: Classic has absorbed a 14.6% max drawdown but still compounds well above the pack, while BTOP50 has kept its drawdown to just 9.7%, proving why it continues to be viewed as the defensive benchmark.
Performance Highlights
Here’s how the indexes stacked up for June:
Classic Trend Index
Managed a small gain of +0.3% in July, only marginally ahead of its peers. The long-term record is where it shines: +101.3% since 2020 with a 13.3% CAGR. It leads every risk-adjusted measure (Sharpe 0.79, Sortino 1.94, MAR 0.91). Even when monthly wins are slim, its structure shows why pure trend persistence compounds over time.
SG CTA Index
Closed July with a narrow +0.2% gain, trimming some of its YTD decline (−7.5%). Longer term it sits at +20.2% since 2020, but middling ratios and a 16.3% drawdown highlight its vulnerability in rotation-heavy regimes.
IASG Trend Following Index
Also up +0.2%. Its −6.8% YTD remains challenging, but the longer record is steadier: +35.0% since 2020, 5.5% CAGR, and relatively moderate drawdowns at 14.8%.
SG Trend Index
Flat at 0.0% for July, leaving it −10.0% YTD and −13.0% over 12 months. It has gained +30.6% since 2020 but carries the highest drawdown in the group (20.4%), keeping risk efficiency muted.
TTU Trend Following Index
Dropped −0.4% in July. With YTD at −10.4% and a 12-month return of −14.9%, the broader program basket continues to struggle in low-trend conditions. Since 2020 it has returned +20.4% with a 3.2% CAGR.
Barclay BTOP50
Down −0.8% in July, but still the best positioned YTD at −4.0%. Its strength is resilience: the lowest drawdown (9.7%) and the highest win rate (59.7%), underlining its role as the ballast index.
Systematic Momentum CTA Index
Finished the month flat at 0.0%. It remains down −8.9% YTD and −12.1% over 12 months. While cumulative return since 2020 is +16.6%, its Sharpe ratio (0.05) and lowest win rate (49.3%) confirm that momentum strategies remain out of phase.
Performance Snapshot
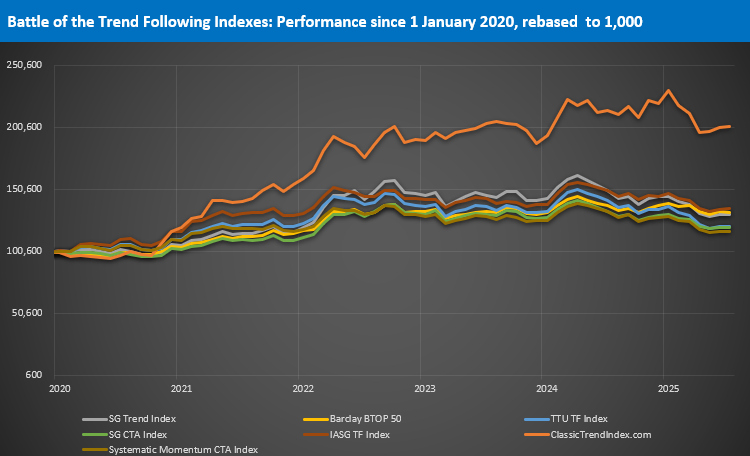
The VAMI chart continues to tell a simple story: Classic Trend Index stands alone. Its cumulative +101.3% since 2020 puts it far ahead of the +16% to +36% range occupied by the other six benchmarks.
Beneath the leader, dispersion is narrow. The diversified indexes remain clustered together, with long-run gains erased by significant drawdowns. Within that pack, BTOP50 distinguishes itself with remarkable consistency: lowest drawdown, highest win rate, and the shallowest YTD decline.
July’s small gains and losses did little to change the bigger picture — one index dominates by structure, the others rotate between resilience and retreat.
Statistical Highlights
Best CAGR: Classic Trend Index – 13.3%
Best MAR Ratio: Classic Trend Index – 0.91
Best Sharpe / Sortino: Classic Trend Index – 0.79 / 1.94
Lowest Max Drawdown: Barclay BTOP50 – 9.7%
Most Winning Months: Classic Trend Index & Barclay BTOP50 – 59.7%
July Reflections
July was about dispersion rather than recovery. A handful of indexes managed marginal gains, but all remain negative for the year. Classic Trend Index’s edge is not about winning every month — it’s about compounding relentlessly over time.
For allocators, BTOP50’s steadiness once again proved its value as a defensive anchor, while broader blends like TTU struggled with trend scarcity. Momentum systems remain out of sync, reinforcing the need for robustness when reversals dominate.
“Conviction does not need to shout. Process that survives is process that compounds.”
About the Indexes
- SG Trend Index
Created by Société Générale, the SG Trend Index represents the largest trend-following CTA programs, focusing on systematic strategies with significant AUM. It captures broad market movements across various assets. More on SG Trend Index - Barclay BTOP50 Index
Managed by BarclayHedge, this index follows the largest investable CTAs, emphasizing diversification across major futures markets. It’s a widely referenced benchmark for managed futures. More on BTOP50 Index - TTU Trend Following Index
Developed by Top Traders Unplugged, the TTU TF Index includes programs with a 15-year track record, emphasizing resilience through experience and diversification across a large ensemble of programs. More on TTU TF Index - SG CTA Index
Another index by Société Générale, the SG CTA Index covers a broader array of CTA strategies, providing insight into the managed futures landscape beyond trend following alone. More on SG CTA Index - IASG Trend Following Index
This index, managed by IASG, tracks CTAs that primarily use trend-following strategies, offering a focused benchmark within the managed futures space. More on IASG TF Index - Classic Trend Index
The Classic Trend Index, curated by the Aussie Turtles, is a benchmark for traditional trend-following strategies, focusing on consistent, systematic approaches across diversified asset classes. More on Classic Trend Index - Systematic Momentum CTA Index
Managed by NilssonHedge, this index tracks CTAs focused on momentum-based strategies, providing a purist view of momentum trading within managed futures. More on Systematic Momentum CTA Index
Stay tuned for next month’s Battle of the Trend Following Indexes to see which benchmarks emerge as the top performers in the trend-following landscape.