Battle of the Trend Following Indexes: September 2025
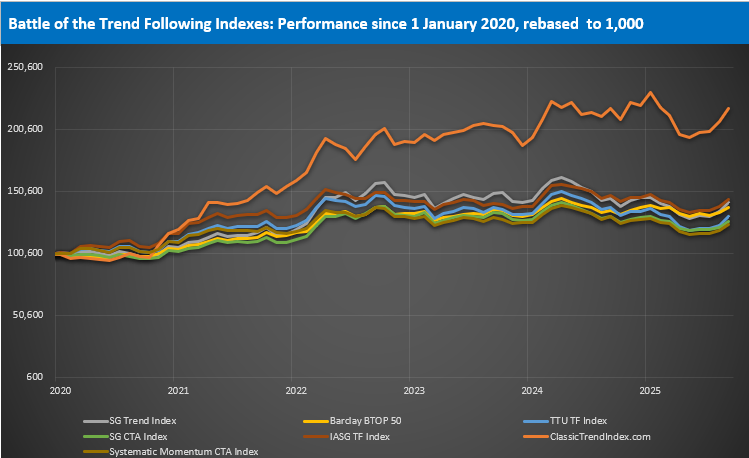
In the Battle of the Trend Following Indexes, we present a monthly update on some of the most respected trend-following benchmarks. Figures reflect performance through 30 Sep 2025, with histories rebased to 1,000 on 1 Jan 2020.

September 2025 Result
Momentum revival lifts all boats.
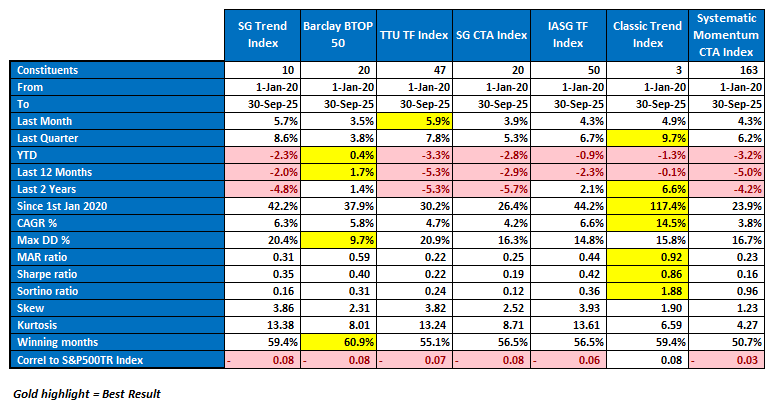
September delivered a broad-based rebound across trend-following benchmarks. Gains were strong across the board, with the TTU Trend Following Index taking top spot at +5.9%, followed closely by the SG Trend Index at +5.7%, Classic Trend Index at +4.9%, and IASG and Systematic Momentum both at +4.3%. The more defensive Barclay BTOP50 rose +3.5%, while the SG CTA Index gained +3.9%.
The rebound extended into quarterly results. Over the last quarter, Classic Trend Index surged +9.7%, the strongest performer once again, while SG Trend added +8.6%, TTU rose +7.8%, and others advanced between +3.8% and +6.7%.
The recovery narrowed year-to-date losses. BTOP50 now leads YTD at +0.4%, the only index in positive territory. All others remain slightly negative, ranging from −0.9% (IASG) to −3.3% (TTU).
The long-term picture remains consistent. Classic Trend Index continues to dominate with a remarkable +117.4% gain since January 2020, translating to a 14.5% CAGR. The next closest, IASG TF, stands at +44.2%, followed by SG Trend (+42.2%) and BTOP50 (+37.9%).
Performance Highlights
Here’s how the indexes stacked up for September:
Classic Trend Index
+4.9% in September, +9.7% for the quarter. YTD −1.3% yet an outstanding +117.4% since January 2020 with a 14.5% CAGR. It leads all risk-adjusted measures (MAR 0.92, Sharpe 0.86, Sortino 1.88). Classic’s long-term compounding and fast drawdown recovery continue to set it apart as the structural leader.
TTU Trend Following Index
+5.9% in September, +7.8% for the quarter. YTD −3.3%, 12-month −5.3%. Since 2020, +30.2% with a 4.7% CAGR and 20.9% max drawdown. The rebound helped restore momentum, but TTU remains mid-pack amid trend scarcity.
SG Trend Index
+5.7% for September, +8.6% for the quarter. YTD −2.3%, 12-month −2.0%. Since 2020, +42.2% with a 6.3% CAGR and 20.4% drawdown. A robust recovery month, confirming renewed directional persistence across diversified futures.
Barclay BTOP50
+3.5% in September, +3.8% for the quarter. The only benchmark positive YTD at +0.4%, with a 5.8% CAGR since 2020. It retains the lowest drawdown (9.7%) and the highest percentage of winning months (60.9%). BTOP50 continues to demonstrate why allocators view it as the stabilizing anchor of the trend universe.
IASG Trend Following Index
+4.3% for September, +6.7% for the quarter. YTD −0.9%. Since 2020, +44.2% (6.6% CAGR) with a 14.8% drawdown. IASG remains a steady performer in the middle of the pack with balanced exposure across markets.
SG CTA Index
+3.9% for September, +5.3% for the quarter. YTD −2.8%, 12-month −2.9%. Since 2020, +26.4% (4.2% CAGR) with a 16.3% drawdown. Broader CTA blends remain subdued relative to trend-focused peers.
Systematic Momentum CTA Index
+4.3% for September, +6.2% for the quarter. YTD −3.2%, 12-month −5.0%. Since 2020, +23.9% (3.8% CAGR) with a 16.7% drawdown. Momentum purists remain below water but showed improving conditions late in the quarter.
Performance Snapshot
The September VAMI chart highlights renewed upward momentum across all benchmarks. Classic Trend Index still towers over peers at +117.4% since January 2020, while the rest remain clustered between +23.9% and +44.2%.
Notably, Classic Trend is now tantalizingly close to reclaiming its all-time high watermark, the result of strong quarterly compounding and faster drawdown recovery. Its steady climb underscores why structural robustness and simple, diversified trend processes continue to outperform more constrained models over time.
Dispersion widened slightly this month as stronger performers reclaimed ground. The rebound reflects improved persistence across commodities and macro sectors, with fixed income volatility creating additional breakout opportunities.
Statistical Highlights
The Classic Trend Index continues to dominate the leaderboard with a CAGR of 14.5%, the highest among all benchmarks. It also leads every major risk-adjusted measure with a MAR ratio of 0.92 and Sharpe and Sortino ratios of 0.86 and 1.88, respectively.
The Barclay BTOP50 maintains its reputation for stability, posting the lowest maximum drawdown at 9.7% and the most winning months at 60.9%, reaffirming its role as the defensive anchor in the trend-following space.
On the performance front, BTOP50 also holds the best year-to-date return at +0.4%, while Classic Trend records the lowest 12-month loss at just −0.1%, underscoring its remarkable consistency and recovery strength.
September Reflections
The September surge marks one of the strongest collective months of 2025. Momentum returned across commodities, rates, and FX, enabling trend systems to capture directional bursts absent for much of the year.
Classic continues to illustrate the compounding advantage of structural diversification and systematic discipline — now edging closer to its prior peak. BTOP50 reinforces the importance of steady consistency through shallow drawdowns.
Momentum- and CTA-blended indices remain sensitive to rotation and consolidation, but their September recovery signals a broad return of trending conditions.
For allocators, the lesson persists: pair compounding power with resilience. Classic provides the engine, BTOP50 provides the ballast.
“September reminded us that the best edge in trend following is not prediction, but persistence. Structure wins when signals realign.”
About the Indexes
- SG Trend Index
Created by Société Générale, the SG Trend Index represents the largest trend-following CTA programs, focusing on systematic strategies with significant AUM. It captures broad market movements across various assets. More on SG Trend Index - Barclay BTOP50 Index
Managed by BarclayHedge, this index follows the largest investable CTAs, emphasizing diversification across major futures markets. It’s a widely referenced benchmark for managed futures. More on BTOP50 Index - TTU Trend Following Index
Developed by Top Traders Unplugged, the TTU TF Index includes programs with a 15-year track record, emphasizing resilience through experience and diversification across a large ensemble of programs. More on TTU TF Index - SG CTA Index
Another index by Société Générale, the SG CTA Index covers a broader array of CTA strategies, providing insight into the managed futures landscape beyond trend following alone. More on SG CTA Index - IASG Trend Following Index
This index, managed by IASG, tracks CTAs that primarily use trend-following strategies, offering a focused benchmark within the managed futures space. More on IASG TF Index - Classic Trend Index
The Classic Trend Index, curated by the Aussie Turtles, is a benchmark for traditional trend-following strategies, focusing on consistent, systematic approaches across diversified asset classes. More on Classic Trend Index - Systematic Momentum CTA Index
Managed by NilssonHedge, this index tracks CTAs focused on momentum-based strategies, providing a purist view of momentum trading within managed futures. More on Systematic Momentum CTA Index
Stay tuned for next month’s Battle of the Trend Following Indexes to see which benchmarks emerge as the top performers in the trend-following landscape.