Battle of the Trend Following Indexes: October 2025
The Battle of the Trend Following Indexes provides a monthly snapshot of the leading trend-following benchmarks. All figures reflect performance through 31 October 2025, with index histories rebased to 1,000 on 1 January 2020.
October 2025 Result
Moderate gains across most trend benchmarks.
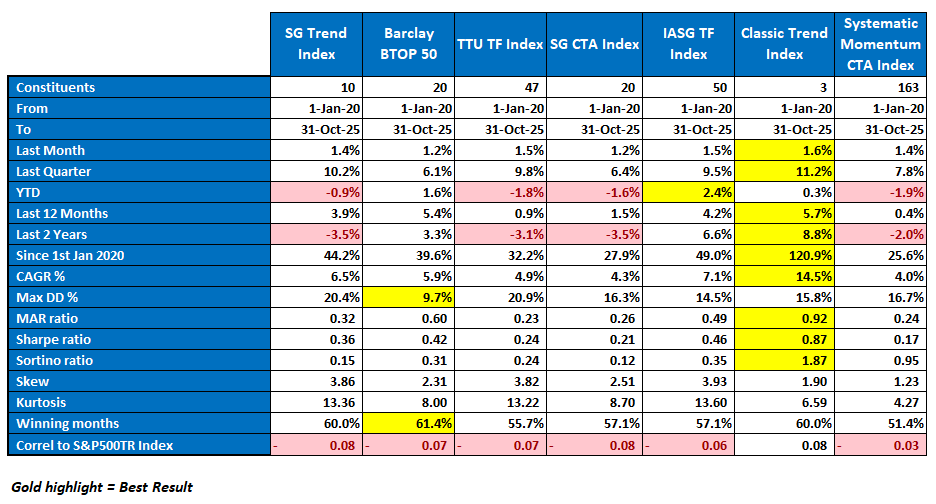
October delivered a steady and broadly positive month for the trend-following complex. Classic Trend Index led the field with a gain of 1.6 percent, closely followed by TTU Trend Following Index at 1.5 percent and IASG TF at 1.5 percent. SG Trend and Systematic Momentum each advanced 1.4 percent, while SG CTA and BTOP50 both rose 1.2 percent.
Quarterly performance remained strong across the cohort. Classic Trend Index recorded the top three month return at 11.2 percent, followed by SG Trend at 10.2 percent, TTU at 9.8 percent, and IASG TF at 9.5 percent. SG CTA and BTOP50 delivered more moderate quarterly results of 6.4 percent and 6.1 percent, while Systematic Momentum rose 7.8 percent.
Year to date results remain mixed. IASG TF holds the strongest position at 2.4 percent, followed by BTOP50 at 1.6 percent and Classic Trend at 0.3 percent. All other indexes remain mildly negative, with YTD figures ranging from −0.9 percent for SG Trend to −1.9 percent for Systematic Momentum.
The long horizon picture continues to show wide dispersion. Classic Trend Index stands out with a cumulative gain of 120.9 percent since January 2020 and a 14.5 percent CAGR, far exceeding the rest of the field. IASG TF follows at 49.0 percent, with SG Trend at 44.2 percent and BTOP50 at 39.6 percent. TTU, SG CTA, and Systematic Momentum remain clustered between 25.6 percent and 32.2 percent.
Performance Highlights
Here is how the indexes performed in October:
Classic Trend Index
+1.6 percent for the month and +11.2 percent for the quarter. YTD +0.3 percent. Since January 2020 the index has gained 120.9 percent with a 14.5 percent CAGR. It leads all major risk adjusted measures with a MAR of 0.92, a Sharpe of 0.87, and a Sortino of 1.87. Classic remains the structural standout due to strong compounding and fast recovery from drawdowns.
TTU Trend Following Index
+1.5 percent for the month and +9.8 percent for the quarter. YTD −1.8 percent and 12 month return of 0.9 percent. Since 2020 the index is up 32.2 percent with a 4.9 percent CAGR and a 20.9 percent drawdown. TTU benefitted from improving trends but remains in the middle of the pack over longer windows.
IASG Trend Following Index
+1.5 percent for the month and +9.5 percent for the quarter. YTD +2.4 percent. Since 2020 the index has gained 49.0 percent with a 7.1 percent CAGR and a 14.5 percent drawdown. IASG continues to offer balanced and consistent returns across diversified markets.
SG Trend Index
+1.4 percent in October and +10.2 percent for the quarter. YTD −0.9 percent and 12 month return of 3.9 percent. Since 2020 the index is up 44.2 percent with a 6.5 percent CAGR and a 20.4 percent drawdown. Conditions strengthened across major macro and commodity markets, supporting a solid quarter.
Systematic Momentum CTA Index
+1.4 percent in October and +7.8 percent for the quarter. YTD −1.9 percent and 12 month return of 0.4 percent. Since 2020 the index has gained 25.6 percent with a 4.0 percent CAGR and a 16.7 percent drawdown. Momentum strategies showed improvement but remain below water for the year.
SG CTA Index
+1.2 percent for the month and +6.4 percent for the quarter. YTD −1.6 percent and 12 month return of 1.5 percent. Since 2020 the index is up 27.9 percent with a 4.3 percent CAGR and a 16.3 percent drawdown. Broader CTA blends remain more muted relative to pure trend strategies.
Barclay BTOP50
+1.2 percent in October and +6.1 percent for the quarter. YTD +1.6 percent. Since 2020 the index has gained 39.6 percent with a 5.9 percent CAGR and the lowest drawdown of the group at 9.7 percent. With the highest proportion of winning months at 61.4 percent, BTOP50 continues to serve as the stability anchor for many allocators.
Performance Snapshot
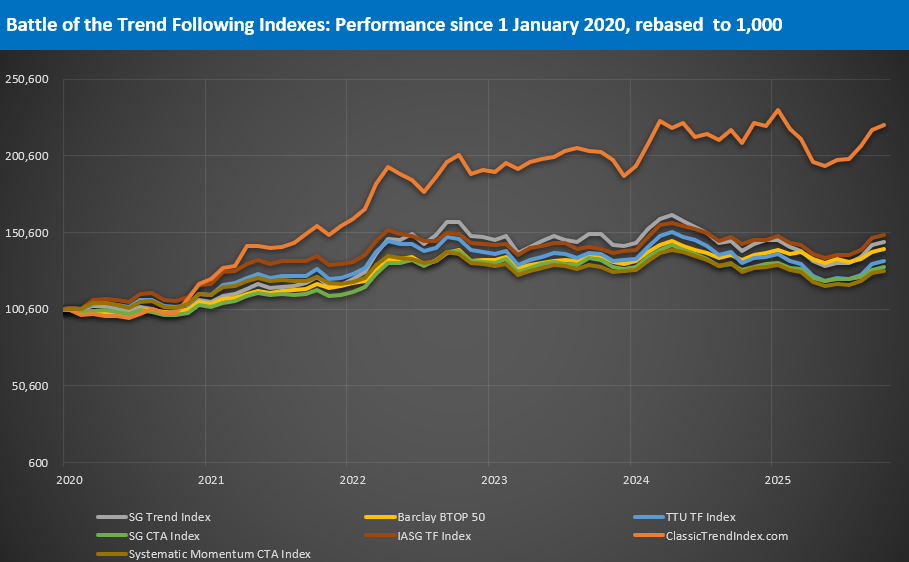
The October VAMI chart shows steady upward progress across the trend universe. Classic Trend Index maintains a commanding lead with a cumulative gain of 120.9 percent since January 2020. The remaining benchmarks remain closely grouped between 25.6 percent and 49.0 percent, reflecting more moderate but stable long term trajectories.
Classic Trend is again approaching its prior high watermark. Its strong quarterly gains and efficient drawdown recovery highlight the advantages of broad diversification, simple rules, and persistent trend capture across global futures markets.
Dispersion widened slightly during the month as the stronger trend programs extended their gains. Renewed persistence across commodities, interest rates, and currency markets provided fresh opportunities, while a pickup in volatility helped break several consolidating structures.
Statistical Highlights
Classic Trend Index continues to dominate the statistical leaderboard. It holds the highest CAGR at 14.5 percent and leads every major risk adjusted measure with a MAR of 0.92, a Sharpe of 0.87, and a Sortino of 1.87. Its long term compounding remains well ahead of all peers.
Barclay BTOP50 maintains its position as the most stable benchmark. It carries the lowest maximum drawdown of 9.7 percent and the highest winning month ratio at 61.4 percent. This reliability reinforces its role as the low variability core for many diversified portfolios.
IASG TF holds the strongest YTD return at 2.4 percent, while Classic Trend records the best 12 month gain at 5.7 percent. SG Trend, TTU, SG CTA, and Systematic Momentum recovered during the quarter but remain slightly negative for the year.
October Reflections
October carried forward the steady improvement that emerged during the third quarter. Trends strengthened across commodities, interest rates, and FX, allowing systematic programs to capture a series of clean directional moves that had been missing earlier in the year.
Classic Trend again demonstrated the power of broad diversification and disciplined design. Its continued climb toward a new peak shows how consistent participation across many markets supports long term compounding. BTOP50 continued to play its familiar stabilising role, delivering positive results with shallow drawdowns and a high proportion of winning months.
Momentum oriented and blended CTA indexes also showed healthy signs of recovery. Their improvement suggests that trend structure is becoming more supportive across macro sectors, with breakouts and extensions occurring more regularly.
For allocators the message remains clear. Balance engines of compounding with sources of resilience. Classic delivers the engine. BTOP50 delivers the ballast.
“October reminded us that the strongest edge in trend following is not prediction, but persistence when structure begins to realign.”
About the Indexes
- SG Trend Index
Created by Société Générale, the SG Trend Index represents the largest trend-following CTA programs, focusing on systematic strategies with significant AUM. It captures broad market movements across various assets. More on SG Trend Index - Barclay BTOP50 Index
Managed by BarclayHedge, this index follows the largest investable CTAs, emphasizing diversification across major futures markets. It’s a widely referenced benchmark for managed futures. More on BTOP50 Index - TTU Trend Following Index
Developed by Top Traders Unplugged, the TTU TF Index includes programs with a 15-year track record, emphasizing resilience through experience and diversification across a large ensemble of programs. More on TTU TF Index - SG CTA Index
Another index by Société Générale, the SG CTA Index covers a broader array of CTA strategies, providing insight into the managed futures landscape beyond trend following alone. More on SG CTA Index - IASG Trend Following Index
This index, managed by IASG, tracks CTAs that primarily use trend-following strategies, offering a focused benchmark within the managed futures space. More on IASG TF Index - Classic Trend Index
The Classic Trend Index, curated by the Aussie Turtles, is a benchmark for traditional trend-following strategies, focusing on consistent, systematic approaches across diversified asset classes. More on Classic Trend Index - Systematic Momentum CTA Index
Managed by NilssonHedge, this index tracks CTAs focused on momentum-based strategies, providing a purist view of momentum trading within managed futures. More on Systematic Momentum CTA Index
Stay tuned for next month’s Battle of the Trend Following Indexes to see which benchmarks emerge as the top performers in the trend-following landscape.
Get the Aussie Turtles® Trend Following Guide
If you want to go deeper into the principles behind trend following and build a process that survives real market conditions, the Aussie Turtles® Trend Following Guide is now available on Amazon.
This book is a field manual for traders who want to move beyond prediction and commit to disciplined, systematic practice. Written by Adam Havryliv and Richard Brennan, it distills decades of experience into a practical and philosophical framework for navigating complex markets.
The guide challenges the myths of consistency and control. It explains why markets evolve through trader impact, serial correlation, and emergent structure rather than forecasts. It does not promise a holy grail system. Instead, it teaches the mindset required to capture the rare asymmetric outliers that drive long term performance.
If you are ready to trade with clarity, resilience, and conviction, this is the place to start. Click on the image below.