Battle of the Trend Following Indexes: November 2025
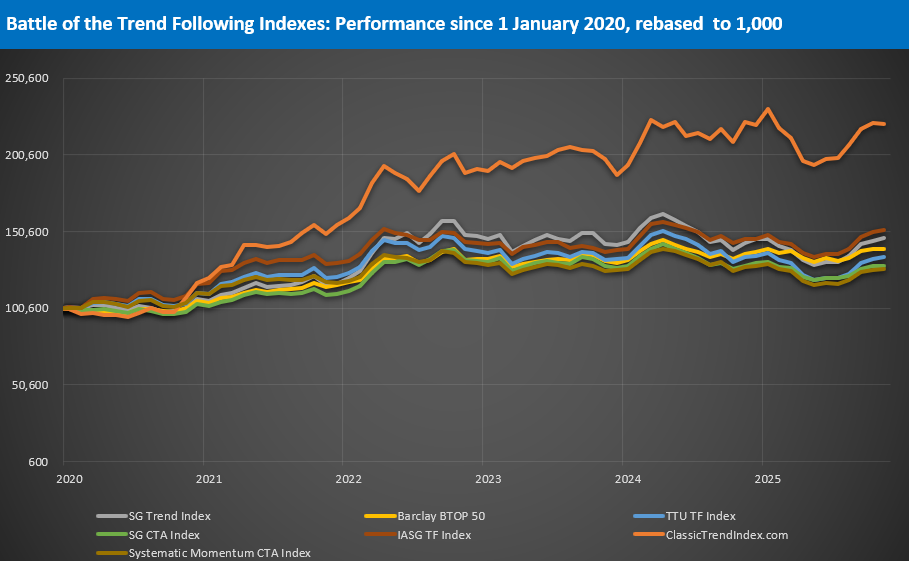
The Battle of the Trend Following Indexes provides a monthly snapshot of the leading trend-following benchmarks. All figures reflect performance through 30 November 2025, with index histories rebased to 1,000 on 1 January 2020.
November 2025 Result
Quiet gains, narrowing dispersion, and late-year consolidation.
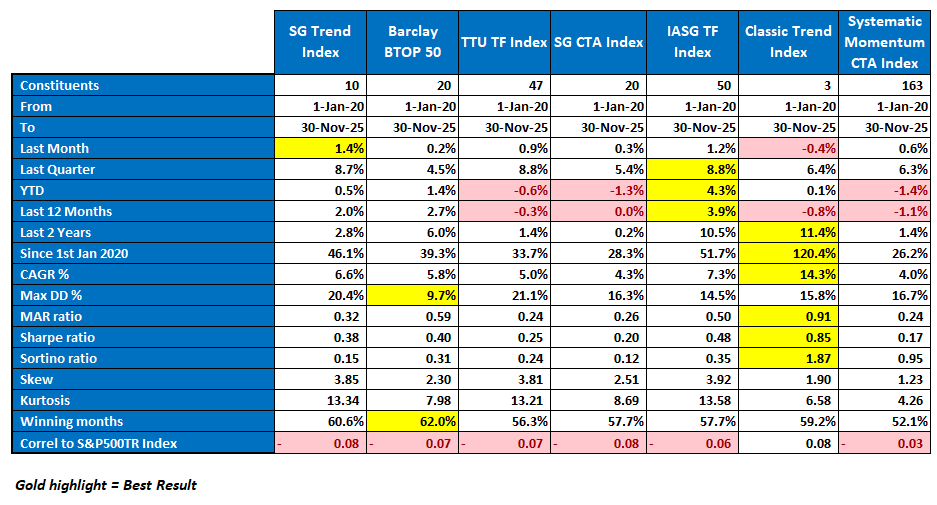
November delivered a modest but broadly positive month across most trend-following benchmarks. SG Trend Index led monthly performance with a gain of 1.4 percent, followed by IASG Trend Following Index at 1.2 percent and TTU Trend Following Index at 0.9 percent. Systematic Momentum CTA Index added 0.6 percent, while SG CTA Index rose 0.3 percent and Barclay BTOP50 advanced 0.2 percent. Classic Trend Index was the only benchmark to finish the month negative, down 0.4 percent, following strong gains earlier in the quarter.
Quarterly results remained constructive across the group. TTU TF and IASG TF shared the top quarterly return at 8.8 percent, narrowly ahead of SG Trend at 8.7 percent. Classic Trend delivered a solid 6.4 percent for the quarter, while Systematic Momentum posted 6.3 percent. SG CTA and BTOP50 recorded more moderate quarterly gains of 5.4 percent and 4.5 percent respectively.
Year to date performance remains mixed. IASG TF Index holds a clear lead at 4.3 percent, followed by BTOP50 at 1.4 percent and SG Trend at 0.5 percent. Classic Trend is marginally positive at 0.1 percent. TTU TF, SG CTA, and Systematic Momentum remain negative for the year, reflecting the uneven trend environment experienced earlier in 2025.
Over longer horizons, dispersion remains wide. Classic Trend Index continues to stand apart with a cumulative gain of 120.4 percent since January 2020 and a 14.3 percent CAGR. IASG TF follows at 51.7 percent, with SG Trend at 46.1 percent and BTOP50 at 39.3 percent. TTU TF, SG CTA, and Systematic Momentum remain clustered between 26.2 percent and 33.7 percent.
Performance Highlights
Here is how the indexes performed in November:
Classic Trend Index
−0.4 percent for November and +6.4 percent for the quarter. YTD +0.1 percent. Since January 2020 the index has gained 120.4 percent with a 14.3 percent CAGR. It continues to lead all major risk-adjusted measures with a MAR of 0.91, a Sharpe of 0.85, and a Sortino of 1.87. November reflected consolidation rather than structural weakness following strong multi-month advances.
TTU Trend Following Index
+0.9 percent for the month and +8.8 percent for the quarter. YTD −0.6 percent. Since 2020 the index is up 33.7 percent with a 5.0 percent CAGR and a 21.1 percent drawdown. Performance benefited from improving trend persistence across commodities and rates, lifting quarterly results to the top of the peer group.
IASG Trend Following Index
+1.2 percent in November and +8.8 percent for the quarter. YTD +4.3 percent. Since 2020 the index has gained 51.7 percent with a 7.3 percent CAGR and a 14.5 percent drawdown. IASG continues to deliver the strongest balance of consistency and growth across the major benchmarks.
SG Trend Index
+1.4 percent for the month and +8.7 percent for the quarter. YTD +0.5 percent. Since 2020 the index is up 46.1 percent with a 6.6 percent CAGR and a 20.4 percent drawdown. Performance was supported by renewed strength across metals, energy, and selected FX trends.
Systematic Momentum CTA Index
+0.6 percent in November and +6.3 percent for the quarter. YTD −1.4 percent. Since 2020 the index has gained 26.2 percent with a 4.0 percent CAGR and a 16.7 percent drawdown. Momentum strategies showed continued stabilization but remain constrained by muted trend extension.
SG CTA Index
+0.3 percent for the month and +5.4 percent for the quarter. YTD −1.3 percent. Since 2020 the index is up 28.3 percent with a 4.3 percent CAGR and a 16.3 percent drawdown. Broader CTA blends delivered steady but unspectacular performance.
Barclay BTOP50 Index
+0.2 percent in November and +4.5 percent for the quarter. YTD +1.4 percent. Since 2020 the index has gained 39.3 percent with a 5.8 percent CAGR and the lowest drawdown of the group at 9.7 percent. With the highest proportion of winning months at 62.0 percent, BTOP50 continues to anchor stability within diversified allocations.
Performance Snapshot
The November VAMI chart shows continued convergence across the trend-following universe. After strong advances earlier in the quarter, performance moderated as markets transitioned into a more consolidative phase. Classic Trend Index remains well ahead on a cumulative basis, while the remaining benchmarks continue to cluster tightly between roughly 26 percent and 52 percent since 2020.
Dispersion narrowed slightly during November as leadership rotated and volatility compressed. Trend persistence remained present, but opportunities became more selective, particularly across rates and currencies.
Statistical Highlights
Classic Trend Index continues to dominate long-term risk-adjusted statistics. It maintains the highest CAGR at 14.3 percent and leads across MAR, Sharpe, and Sortino ratios. Its ability to compound while recovering efficiently from drawdowns remains unmatched.
Barclay BTOP50 again stands out as the most stable benchmark, with the lowest maximum drawdown at 9.7 percent and the highest winning month ratio. This stability reinforces its role as a defensive core within managed futures allocations.
IASG TF remains the strongest performer on a YTD basis, while Classic Trend retains leadership across longer horizons. Correlation to global equities remains low across all benchmarks, underscoring the diversification benefits of systematic trend exposure.
November Reflections
November marked a pause rather than a reversal. After a productive third quarter and a strong October, trend-following programs entered a phase of consolidation as markets digested earlier moves. Gains were modest, dispersion narrowed, and leadership rotated.
The month reinforced a familiar pattern. Strong trend programs do not advance in straight lines. Periods of digestion are part of the compounding process, particularly following broad-based alignment across commodities and macro markets.
For allocators, the message remains unchanged. Combine engines of long-term compounding with sources of structural stability. Classic Trend continues to provide the engine. BTOP50 continues to provide the ballast.
“November reminded us that trend following is not about constant motion, but about staying positioned when structure pauses before its next move.”
About the Indexes
- SG Trend Index
Created by Société Générale, the SG Trend Index represents the largest trend-following CTA programs, focusing on systematic strategies with significant AUM. It captures broad market movements across various assets. More on SG Trend Index - Barclay BTOP50 Index
Managed by BarclayHedge, this index follows the largest investable CTAs, emphasizing diversification across major futures markets. It’s a widely referenced benchmark for managed futures. More on BTOP50 Index - TTU Trend Following Index
Developed by Top Traders Unplugged, the TTU TF Index includes programs with a 15-year track record, emphasizing resilience through experience and diversification across a large ensemble of programs. More on TTU TF Index - SG CTA Index
Another index by Société Générale, the SG CTA Index covers a broader array of CTA strategies, providing insight into the managed futures landscape beyond trend following alone. More on SG CTA Index - IASG Trend Following Index
This index, managed by IASG, tracks CTAs that primarily use trend-following strategies, offering a focused benchmark within the managed futures space. More on IASG TF Index - Classic Trend Index
The Classic Trend Index, curated by the Aussie Turtles, is a benchmark for traditional trend-following strategies, focusing on consistent, systematic approaches across diversified asset classes. More on Classic Trend Index - Systematic Momentum CTA Index
Managed by NilssonHedge, this index tracks CTAs focused on momentum-based strategies, providing a purist view of momentum trading within managed futures. More on Systematic Momentum CTA Index
Stay tuned for next month’s Battle of the Trend Following Indexes to see which benchmarks emerge as the top performers in the trend-following landscape.
Get the Aussie Turtles® Trend Following Guide
If you want to go deeper into the principles behind trend following and build a process that survives real market conditions, the Aussie Turtles® Trend Following Guide is now available on Amazon.
This book is a field manual for traders who want to move beyond prediction and commit to disciplined, systematic practice. Written by Adam Havryliv and Richard Brennan, it distills decades of experience into a practical and philosophical framework for navigating complex markets.
The guide challenges the myths of consistency and control. It explains why markets evolve through trader impact, serial correlation, and emergent structure rather than forecasts. It does not promise a holy grail system. Instead, it teaches the mindset required to capture the rare asymmetric outliers that drive long term performance.
If you are ready to trade with clarity, resilience, and conviction, this is the place to start. Click on the image below.