Battle of the Trend Following Indexes: February 2026
The Battle of the Trend Following Indexes provides a monthly snapshot of the leading trend-following benchmarks. All figures reflect performance through 28 February 2026, with index histories rebased to 1,000 on 1 January 2020.

February 2026 Result
Metals explode, trends surge, and systematic strategies build on an exceptional start to 2026.
February extended the strong momentum from January, with the trend-following community delivering another broadly positive month. Classic Trend Index retained its leadership position, advancing 5.3 percent to claim top billing for the second consecutive month. TTU Trend Following Index followed with a strong 4.6 percent gain, while SG Trend Index added 3.9 percent and IASG Trend Following Index rose 4.0 percent. Systematic Momentum CTA Index gained 3.6 percent, Barclay BTOP50 added 3.5 percent, and SG CTA Index posted 3.4 percent. Every benchmark finished in positive territory, marking a second consecutive month of universal gains across all seven indexes.
The month unfolded across three distinct phases. An early pullback in energy, driven particularly by the violent reversal in natural gas, weighed on the first week of February, with the SG Trend Index briefly dipping to -0.43 percent month-to-date. The TTU Barometer retreated from 68 percent to 55 percent and then further to 43 percent by mid-month as trend conditions cooled and equity markets wobbled. However, the second half of February staged a decisive recovery. Metals ignited with particular force in the final week: silver surged 12.42 percent, platinum gained 9.08 percent, and gold extended its historic advance above $5,296, reaching fresh all-time highs for the fourth consecutive week. The TTU Barometer surged 16 percentage points in the final week, recovering from 45 percent to 61 percent and crossing back into Very Strong territory as bonds, grains, and energy contributed supplementary gains.
Trailing quarterly results reflect the powerful momentum accumulated over the past three months. Classic Trend leads the three-month window at 14.6 percent, followed by TTU TF at 12.6 percent and IASG TF at 11.5 percent. SG Trend added 10.9 percent for the quarter, while SG CTA, Barclay BTOP50, and Systematic Momentum returned 9.6 percent, 8.3 percent, and 9.8 percent respectively.
Year to date, Classic Trend continues to pace the field at 10.5 percent after two months. TTU TF follows at 9.9 percent, with SG Trend at 8.8 percent. IASG TF has gained 8.4 percent, while SG CTA stands at 8.3 percent, Systematic Momentum at 7.7 percent, and Barclay BTOP50 at 7.0 percent.
Over the long horizon from January 2020, Classic Trend Index’s cumulative advantage has extended further. The index has now gained 152.6 percent since inception, a compound annual growth rate of 16.2 percent. IASG TF follows at 68.0 percent, with SG Trend at 62.1 percent and Barclay BTOP50 at 51.4 percent. TTU TF, SG CTA, and Systematic Momentum sit between 38.5 percent and 48.9 percent.
Performance Highlights
Here is how the indexes performed in February:
Classic Trend Index
+5.3 percent for February, retaining the monthly lead for the second consecutive month. Trailing quarter +14.6 percent. YTD +10.5 percent. Since January 2020 the index has gained 152.6 percent with a 16.2 percent CAGR. Classic Trend continues to lead all major risk-adjusted measures with a MAR of 1.03, a Sharpe of 0.98, and a Sortino of 1.80. The metals explosion in the final week of February, combined with strong trending conditions across bonds and grains, allowed the index to deliver its second consecutive month above 5 percent. The cumulative lead over the broader trend universe continues to expand, now exceeding 152 percent since inception.
Barclay BTOP50 Index
+3.5 percent for February. Trailing quarter +8.3 percent. YTD +7.0 percent. Since 2020 the index has gained 51.4 percent with a 7.0 percent CAGR and the lowest drawdown of the group at 9.7 percent. With the highest proportion of winning months at 63.5 percent, BTOP50 navigated the month’s volatility with characteristic stability, recovering from early weakness to post another positive result. Its defensive profile proved valuable during the mid-month barometer dip when trend conditions deteriorated.
SG Trend Index
+3.9 percent for February and +10.9 percent for the trailing quarter. YTD +8.8 percent. Since 2020 the index is up 62.1 percent with an 8.1 percent CAGR and a 20.4 percent drawdown. The large-programme trend benchmark weathered the intra-month turbulence and recovered strongly as metals surged in the final week. The year-to-date reading of 8.8 percent after just two months confirms an exceptional start to 2026 for systematic trend followers.
SG CTA Index
+3.4 percent for the month and +9.6 percent for the trailing quarter. YTD +8.3 percent. Since 2020 the index is up 40.6 percent with a 5.7 percent CAGR and a 16.3 percent drawdown. Broader CTA blends participated meaningfully in February’s recovery, benefiting from the precious metals breakout and bond strength in the latter half of the month.
TTU Trend Following Index
+4.6 percent for February and +12.6 percent for the trailing quarter. YTD +9.9 percent. Since 2020 the index has gained 48.9 percent with a 6.7 percent CAGR and a 20.8 percent drawdown. The large-ensemble benchmark delivered its strongest monthly contribution since January, reflecting the broad-based nature of February’s late-month trend acceleration. The 4.6 percent gain places TTU TF second among the seven benchmarks for the month.
IASG Trend Following Index
+4.0 percent in February and +11.5 percent for the trailing quarter. YTD +8.4 percent. Since 2020 the index has gained 68.0 percent with an 8.8 percent CAGR and a 14.9 percent drawdown. IASG continues its impressive balance of growth and consistency, adding meaningfully to January’s gains and maintaining the second-highest cumulative return among the seven benchmarks.
Systematic Momentum CTA Index
+3.6 percent in February and +9.8 percent for the trailing quarter. YTD +7.7 percent. Since 2020 the index has gained 38.5 percent with a 5.4 percent CAGR and a 16.7 percent drawdown. Momentum strategies participated in the month’s recovery, with the late-February metals explosion providing particularly strong tailwinds for momentum-oriented positioning across precious metals.
Performance Snapshot
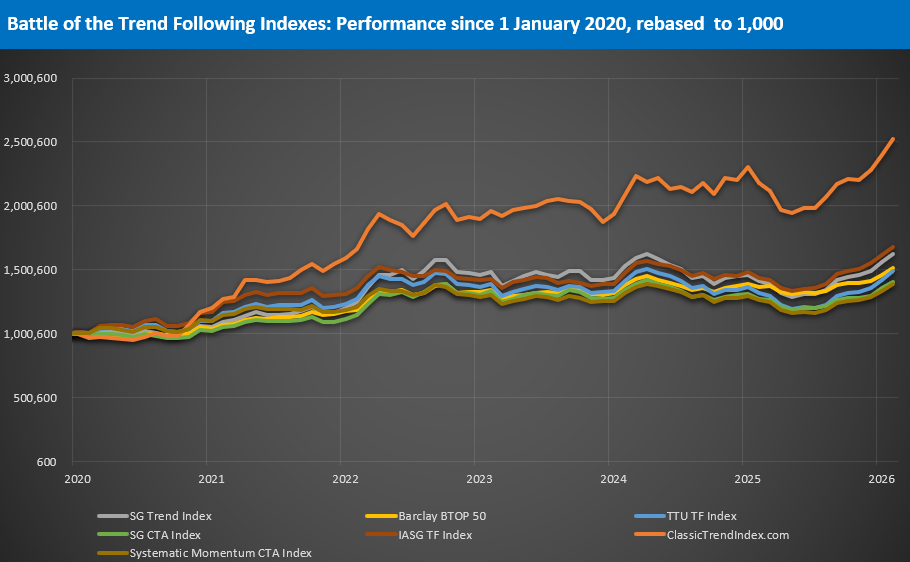
The February VAMI chart shows Classic Trend Index pushing decisively above the 2,500 level, extending its commanding separation from the broader trend-following universe. The index’s trajectory through early 2026 has been parabolic, with the gap to the next-best performer widening further in February. The remaining benchmarks continue to advance, clustered between roughly 1,380 and 1,680 since 2020, with all moving higher in February.
The two-month chart of 2026 performance tells a powerful story. Every benchmark has delivered positive returns in both January and February, a streak of unanimous gains rarely seen across a seven-index universe. The metals complex’s explosive final week transformed what could have been a modest month into another strong result, demonstrating the power of diversified trend exposure when asset classes align.
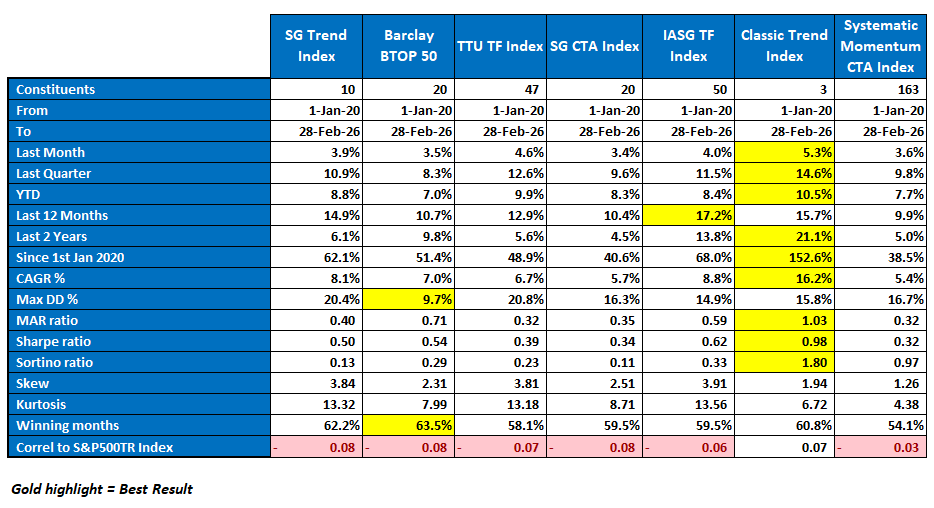
Statistical Highlights
Classic Trend Index continues to dominate long-term risk-adjusted statistics across every major measure. Its CAGR of 16.2 percent leads the field by a wide margin, and it retains leadership across the MAR ratio at 1.03, Sharpe at 0.98, and Sortino at 1.80. The maximum drawdown of 15.8 percent is well-controlled relative to the exceptional compounding generated over six years. Classic Trend’s ability to compound efficiently while limiting drawdowns remains unmatched across all seven benchmarks.
Barclay BTOP50 again stands out as the most stable benchmark, with the lowest maximum drawdown at 9.7 percent and the highest winning month ratio at 63.5 percent. Its MAR ratio of 0.71 reflects the value of consistent, low-volatility returns for allocators seeking diversification without sacrificing upside. February’s 3.5 percent gain, delivered despite intra-month turbulence, demonstrates BTOP50’s resilience.
IASG TF leads the trailing twelve-month window at 17.2 percent, reflecting its exceptional performance through 2025 and into early 2026. Classic Trend retains leadership across all longer horizons including the two-year window at 21.1 percent and all longer periods since January 2020. Correlation to global equities remains low across all benchmarks, ranging from -0.03 to 0.08, underscoring the enduring diversification benefits of systematic trend exposure.
The dispersion across benchmarks in February was 1.9 percentage points, slightly wider than January’s historic 1.1 percent compression but still well below historical averages. The broad alignment of returns across all seven indexes for two consecutive months reflects a genuine period of favourable and broad-based trending conditions.
February Reflections
February tested the trend-following community in ways January did not. The month began with a significant energy reversal, with natural gas giving back 21 percent in a single week after surging 20 percent the prior month, and the TTU Barometer retreated sharply from its January high of 68 percent to 43 percent by mid-month, briefly touching neutral territory. For portfolios that had built significant long energy exposure, the whipsaw was severe. The SG Trend Index briefly turned negative for the month in the opening weeks.
What followed was a textbook demonstration of how diversified trend portfolios recover. As energy corrected, capital rotated into metals, grains, and bonds. Gold extended its historic advance above $5,296. Silver exploded 12 percent in a single week. Platinum surged. Bonds resumed their rally as safe-haven demand emerged alongside equity uncertainty. Grains posted their fourth consecutive positive week by month end. The TTU Barometer recovered 16 percentage points in the final week, crossing back into Very Strong territory, and fund performance accelerated precisely as conditions improved.
The month’s narrative reinforces a core principle of systematic trend following: recoveries, when they come, come quickly. Allocators who endured the mid-month drawdown and remained positioned were rewarded with strong final results. The patience required of trend-following allocators is not passive tolerance of losses. It is active belief in the systematic process during periods of temporary disruption.
For the Classic Trend Index, February’s 5.3 percent result was particularly satisfying. The metals complex’s explosive final week aligned with positioning built over weeks of patient accumulation. The index’s long-term advantage over the peer group reflects precisely this: systematic processes that build positions deliberately and hold them through short-term disruption to capture the full magnitude of eventual moves.
Two months into 2026, the message is clear. Trending conditions are strong, the breadth of gains across asset classes is exceptional, and systematic strategies are delivering. The combination of favourable macro conditions, including gold at all-time highs, the bond rally resuming, and the grain complex strengthening, suggests the environment may have further to run.
“February reminded the trend-following community why discipline matters. The early-month turbulence passed. The metals breakout arrived. And those who held their positions captured it all.”
About the Indexes
- SG Trend Index
Created by Société Générale, the SG Trend Index represents the largest trend-following CTA programs, focusing on systematic strategies with significant AUM. It captures broad market movements across various assets. More on SG Trend Index - Barclay BTOP50 Index
Managed by BarclayHedge, this index follows the largest investable CTAs, emphasizing diversification across major futures markets. It’s a widely referenced benchmark for managed futures. More on BTOP50 Index - TTU Trend Following Index
Developed by Top Traders Unplugged, the TTU TF Index includes programs with a 15-year track record, emphasizing resilience through experience and diversification across a large ensemble of programs. More on TTU TF Index - SG CTA Index
Another index by Société Générale, the SG CTA Index covers a broader array of CTA strategies, providing insight into the managed futures landscape beyond trend following alone. More on SG CTA Index - IASG Trend Following Index
This index, managed by IASG, tracks CTAs that primarily use trend-following strategies, offering a focused benchmark within the managed futures space. More on IASG TF Index - Classic Trend Index
The Classic Trend Index, curated by the Aussie Turtles, is a benchmark for traditional trend-following strategies, focusing on consistent, systematic approaches across diversified asset classes. More on Classic Trend Index - Systematic Momentum CTA Index
Managed by NilssonHedge, this index tracks CTAs focused on momentum-based strategies, providing a purist view of momentum trading within managed futures. More on Systematic Momentum CTA Index
Stay tuned for next month’s Battle of the Trend Following Indexes to see which benchmarks emerge as the top performers in the trend-following landscape.
Get the Aussie Turtles® Trend Following Guide
If you want to go deeper into the principles behind trend following and build a process that survives real market conditions, the Aussie Turtles® Trend Following Guide is now available on Amazon.
This book is a field manual for traders who want to move beyond prediction and commit to disciplined, systematic practice. Written by Adam Havryliv and Richard Brennan, it distills decades of experience into a practical and philosophical framework for navigating complex markets.
The guide challenges the myths of consistency and control. It explains why markets evolve through trader impact, serial correlation, and emergent structure rather than forecasts. It does not promise a holy grail system. Instead, it teaches the mindset required to capture the rare asymmetric outliers that drive long term performance.
If you are ready to trade with clarity, resilience, and conviction, this is the place to start. Click on the image below.