Battle of the Trend Following Indexes: May 2026
The Battle of the Trend Following Indexes provides a monthly snapshot of the leading trend-following benchmarks. All figures reflect performance through 31 May 2026, with index histories rebased to 1,000 on 1 January 2020.
May 2026 Result
May was April’s opposite in the way that matters most. April’s story was dispersion; May’s was the absence of it. The seven indexes finished the month inside a band of roughly one percentage point, and the telling fact is not which one led but that none of them had much chance to.
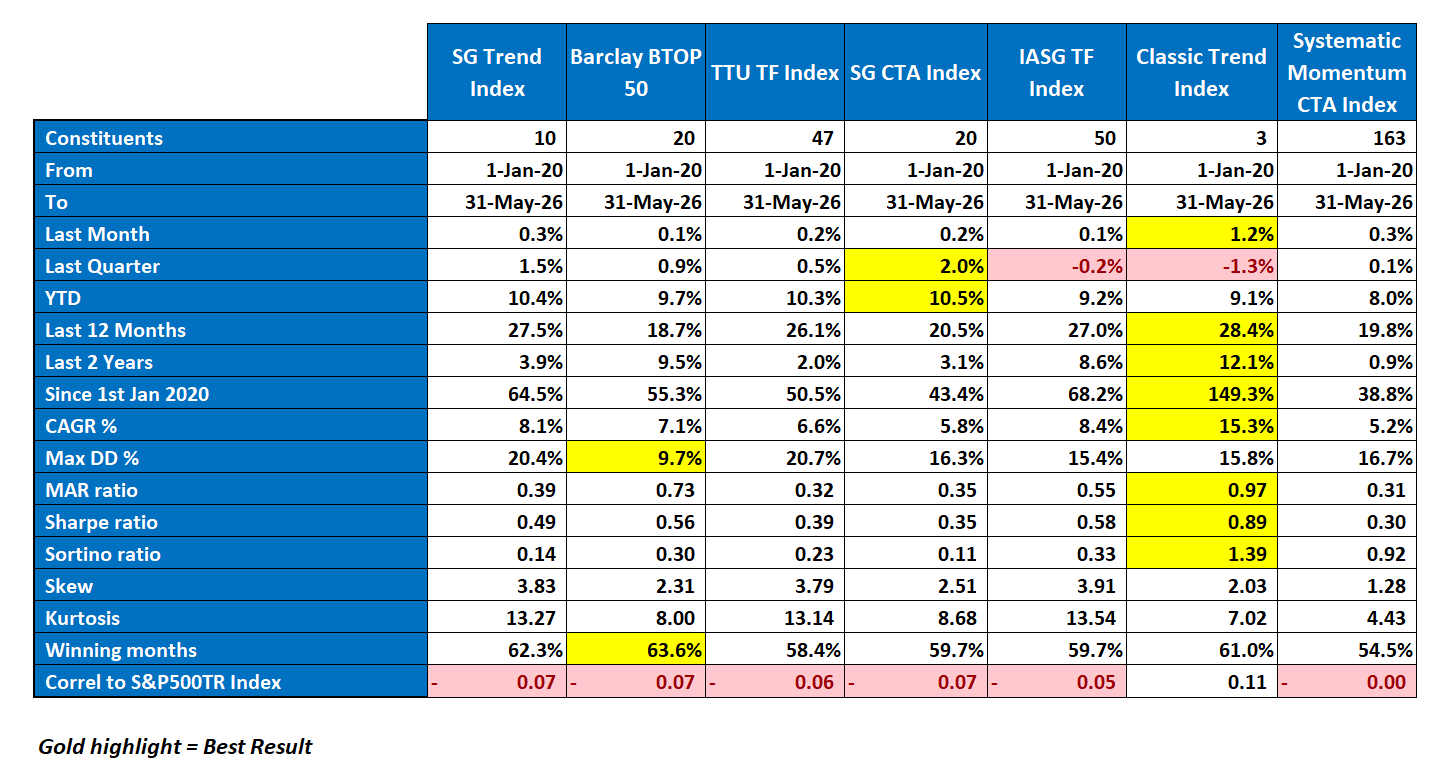
Classic Trend posted the largest gain for a second consecutive month at +1.2%, a fraction of April’s +6.7%. Systematic Momentum and SG Trend each returned +0.3%, SG CTA and TTU each +0.2%, and BTOP50 and IASG each +0.1%. Every index finished positive, but only just.
The reason sits in the trend environment. The TTU Trend Barometer printed 43, 57, 45, 32 across the four weeks, ending the month inside Weak-environment territory for the first time in the current sequence, its rate of change classified as Falling Rapidly. Energy reversed direction in three of those four weeks as the Iran and Strait of Hormuz cycle alternated between escalation and diplomacy, and by month-end almost every sector had fractured into two-way internal splits. Persistent trends, the raw material of trend following, were scarce.
Year to date, leadership has shifted. SG CTA now leads at +10.5%, narrowly ahead of SG Trend at +10.4% and TTU at +10.3%. Classic Trend sits at +9.1%, still rebuilding from its March drawdown, which the trailing-quarter window continues to carry: its Last Quarter reading of -1.3% is the lowest of the seven and one of only two negative prints, alongside IASG at -0.2%.
The longer horizons are unchanged, and one has improved. Classic Trend has taken the Last 12 Months lead at +28.4%, the horizon on which it is most directly compared, and continues to lead every structural and risk-adjusted measure: CAGR 15.3%, MAR 0.97, Sharpe 0.89, Sortino 1.39, and total return of 149.3% since 1 January 2020. BTOP50 keeps the lowest drawdown at 9.7% and the highest win rate at 63.6%. One honest change at the margin: IASG’s 15.4% drawdown now edges Classic Trend’s 15.8% for second-lowest, a slot Classic held a month ago.
Classic Trend’s result is the third state of a convex design. April was the upside expression of that profile and March the downside; May was neither. Convexity amplifies persistent trends, and May offered almost none to amplify, so the construction that produces the largest gains and the largest drawdowns alike produced a modest one. When the trend environment fractures, the distance between a concentrated, high-convexity index and a diversified, lower-convexity one narrows, because neither has clean direction to capture or to miss. That compression, not the leadership, is the signature of the month, and where each allocator sits on the convexity spectrum remains a matter for their own judgement.
Performance Highlights
Here is how the indexes performed in May:
Classic Trend Index
+1.2% for May, the largest monthly gain among the seven benchmarks for a second consecutive month, though in a far narrower field than April. Trailing quarter -1.3%, the lowest of the seven and a reminder that the March drawdown still anchors the trailing-quarter window. YTD +9.1%. Since January 2020 the index has gained 149.3% with a 15.3% CAGR. Classic Trend retains leadership across the long-term risk-adjusted measures, with a MAR of 0.97, a Sharpe of 0.89, and a Sortino of 1.39, and has moved into the lead on the Last 12 Months horizon at +28.4%. The maximum drawdown of 15.8% is the third-lowest in the comparison. The +1.2% is the muted reading of the same construction that produced +6.7% in April: in a month without persistent trends, it had little to work with.
Barclay BTOP50 Index
+0.1% for May, among the smallest monthly results in the group. Trailing quarter +0.9%. YTD +9.7%. Since 2020 the index has gained 55.3% with a 7.1% CAGR and the lowest drawdown of the group at 9.7%. With the highest proportion of winning months at 63.6%, BTOP50 again demonstrated the value of its defensive profile, holding positive ground in a month that gave most constructions very little. The diversified, volatility-targeted construction continues to do exactly what it is designed to do through a fractured trend environment: capture a small, steady portion of whatever directional movement remains, without taking on additional variance.
SG Trend Index
+0.3% for May and +1.5% for the trailing quarter. YTD +10.4%, a fraction behind the SG CTA Index at the top of the year-to-date table. Since 2020 the index is up 64.5% with an 8.1% CAGR and a 20.4% drawdown. The large-programme trend benchmark held its double-digit YTD reading despite a volatile intra-month path: the index moved from -0.61% MTD at the close of the first week, up to +2.13% in the second, then back to +1.19% and +0.38% as the energy whipsaw reversed twice more. The round trip inside the month left the headline almost where it began, a faithful reflection of a market that moved sharply without trending.
SG CTA Index
+0.2% for May and +2.0% for the trailing quarter, the best Last Quarter reading in the comparison. YTD +10.5%, the lead position in the year-to-date table. Since 2020 the index is up 43.4% with a 5.8% CAGR and a 16.3% drawdown. The broader CTA blend matched the trend-focused peers on the month and edged ahead of them on the trailing quarter and year to date, its diversification absorbing the May whipsaw more evenly than the concentrated benchmarks could.
TTU Trend Following Index
+0.2% for May and +0.5% for the trailing quarter. YTD +10.3%, having ceded the year-to-date lead it held at the end of April. Since 2020 the index has gained 50.5% with a 6.6% CAGR and a 20.7% drawdown, the highest in the comparison. The Last 12 Months reading of 26.1% sits roughly in line with the SG Trend Index. The 47-program ensemble’s breadth absorbed the May fracturing without material damage, but the diversification that protected it through the whipsaw also limited it in a month where the cleanest cross-asset trend, the equity advance, rewarded concentration more than breadth.
IASG Trend Following Index
+0.1% for May and -0.2% for the trailing quarter, the second of the two negative Last Quarter readings in the group. YTD +9.2%. Since 2020 the index has gained 68.2% with an 8.4% CAGR, the second-highest of the comparison behind Classic Trend, and a maximum drawdown of 15.4% that is now the second-lowest in the group. IASG retains a strong showing across the trailing twelve-month window at +27.0%, third behind Classic Trend and SG Trend, and a Last 2 Years return of +8.6% that places it third on that horizon. The MAR of 0.55 and Sharpe of 0.58 remain the best peer-relative readings outside Classic Trend.
Systematic Momentum CTA Index
+0.3% in May and +0.1% for the trailing quarter. YTD +8.0%, the lowest of the seven. Since 2020 the index has gained 38.8% with a 5.2% CAGR and a 16.7% drawdown. The broad 163-constituent momentum benchmark delivered a middle-of-the-pack monthly result, the diversification across a very large number of programs producing a smooth but constrained reading in a month where there was little persistent trend to capture. Its Sortino ratio of 0.92 is the second-highest in the comparison, a function of how the construction has historically distributed its downside.
Performance Snapshot
The table below presents the comparative statistics for the seven trend-following indexes through 31 May 2026. Gold-highlighted cells indicate the best result in each row.
Performance Since 1 January 2020
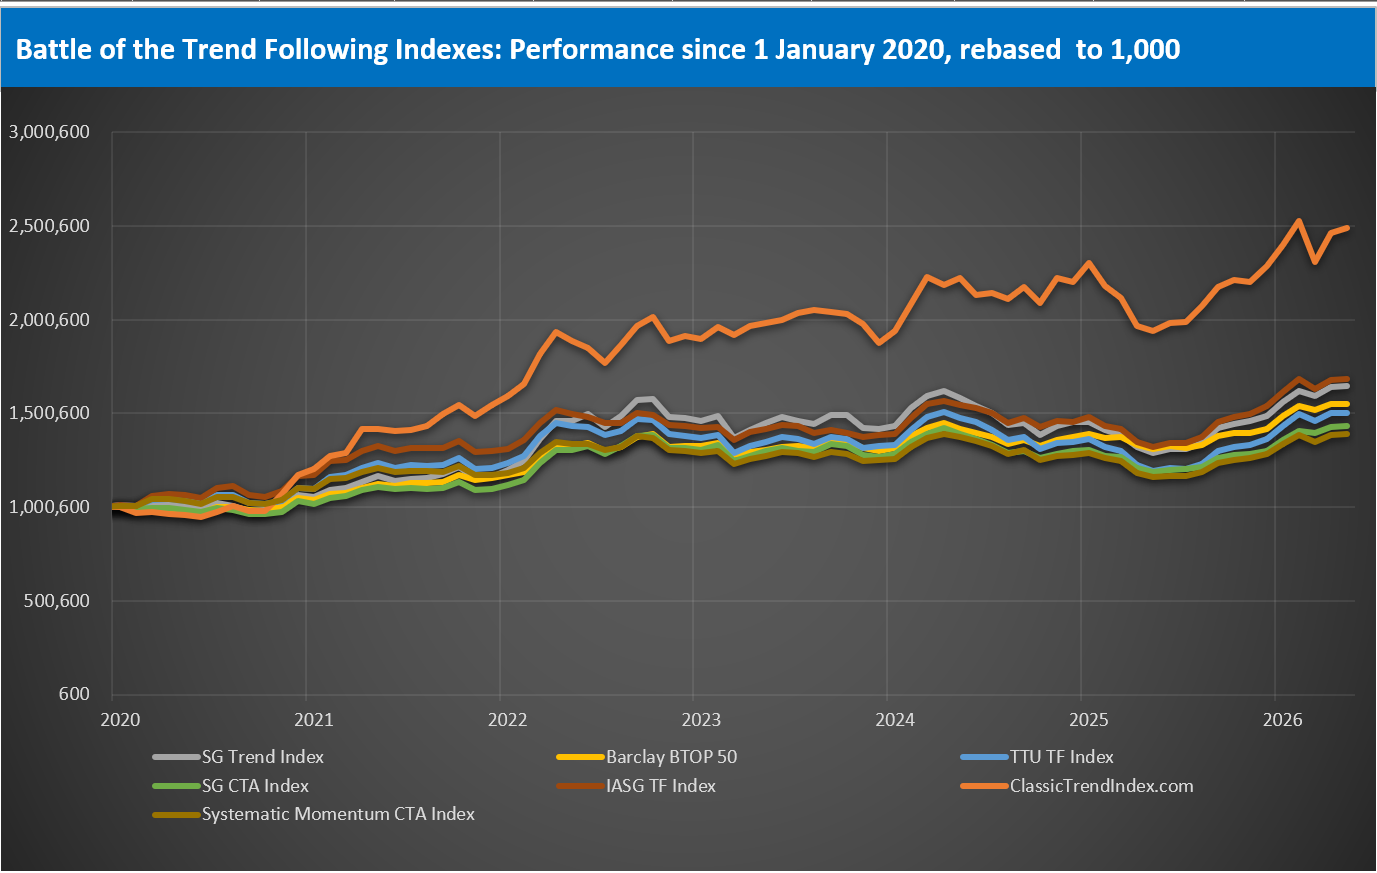
The chart below shows the value-added monthly index (VAMI) for each of the seven indexes, rebased to 1,000 on 1 January 2020. The Classic Trend Index remains substantially ahead of the peer group on a since-inception basis.
Performance Commentary
Classic Trend Index
Classic Trend gained 1.2% in May, the largest single-month return across the seven indexes for a second consecutive month, although in a field compressed into a single percentage point the leadership carried far less weight than April’s two-to-one margin. The index closes May at 9.1% year to date, below the SG CTA, SG Trend, and TTU peers that lead the table above 10%. The Last Quarter return of -1.3% is the lowest in the comparison and one of only two negative readings, confirming that the March drawdown has not yet been recovered on the trailing-quarter horizon. The longer-horizon picture is the counterweight. The index has moved into the Last 12 Months lead at 28.4%, ahead of SG Trend at 27.5% and IASG at 27.0%. The Last 2 Years return of 12.1% is roughly 2.6 percentage points ahead of BTOP50 in second. Since 1 January 2020 the index has returned 149.3%, against 68.2% for IASG and 64.5% for SG Trend. The MAR of 0.97, Sharpe of 0.89, and Sortino of 1.39 remain best-in-class. The maximum drawdown of 15.8% is now the third-lowest, with IASG at 15.4% and BTOP50 at 9.7% ahead of it. The month was the dormant state of the index’s convexity: with no persistent trend on offer, the design that drives its sharpest moves in either direction stayed quiet.
Barclay BTOP50 Index
The Barclay BTOP50 returned 0.1% in May, among the smallest single-month returns in the comparison and consistent with its established role. The year-to-date reading sits at 9.7%, with a Last 12 Months return of 18.7% and a Last 2 Years return of 9.5%, the latter second only to Classic Trend on that horizon. The maximum drawdown of 9.7% remains the best in the comparison by a wide margin, and the winning-months reading of 63.6% is the highest. The MAR of 0.73 ranks second behind Classic Trend. In a month where the trend environment fractured and most constructions struggled to find persistent direction, the diversified, lower-concentration BTOP50 did what it is built to do: it held positive ground without taking on the variance that the more concentrated benchmarks absorbed through the energy whipsaw.
SG Trend Index
The SG Trend Index returned 0.3% in May and sits at 10.4% year to date, a fraction behind the SG CTA Index for the year-to-date lead. The Last 12 Months reading of 27.5% is second only to Classic Trend, and the Last Quarter return of 1.5% is second behind SG CTA. The index has been the steadiest reference for trend-following performance through 2026, and the May path illustrates why the month was difficult for the discipline: the week-by-week MTD reading moved from -0.61% to +2.13% to +1.19% and closed near +0.38%, a round trip that mirrored the energy complex reversing twice. The double-digit YTD figure has held throughout, but the month added almost nothing to it.
SG CTA Index
The SG CTA Index returned 0.2% in May and leads both the year-to-date table at 10.5% and the Last Quarter table at 2.0%. The Last 12 Months return of 20.5% sits below the trend-focused peers, reflecting the broader systematic construction underlying the SG CTA versus the more concentrated trend signals captured by the SG Trend Index. The Last 2 Years return of 3.1% and the Sharpe of 0.35 sit at the lower end of the comparison. The index continues to deliver the most diversified systematic exposure within the seven, and in a fractured month that breadth was an advantage: the diluted factor set rode out the energy and grain reversals more smoothly than the trend-specific reference points, leaving it at the top of the shorter-horizon tables.
TTU Trend Following Index
The TTU Trend Following Index returned 0.2% in May and now sits at 10.3% year to date, having ceded the year-to-date and Last Quarter leads it held at the end of April. The Last 12 Months reading of 26.1% sits roughly in line with SG Trend. The 47 underlying constituents provide a broader sampling of the trend-following manager universe than the SG Trend Index, and that breadth steadied the index through the May fracturing. The maximum drawdown of 20.7% is the highest in the comparison and the Sharpe of 0.39 sits at the lower end, the trade-off in carrying a broader, higher-volatility constituent set.
IASG Trend Following Index
The IASG Trend Following Index returned 0.1% in May and is at 9.2% year to date, with a Last Quarter reading of -0.2%, one of the two negative trailing-quarter prints in the group. The Last 12 Months return of 27.0% is third in the comparison, narrowly behind Classic Trend and SG Trend, and the Last 2 Years return of 8.6% sits third on that horizon. The Since 1 January 2020 return of 68.2% and the CAGR of 8.4% are each second only to Classic Trend, and the maximum drawdown of 15.4% is now the second-lowest in the group, edging Classic Trend. The MAR of 0.55 and Sharpe of 0.58 are the best peer-relative readings outside Classic Trend. With 50 constituents, IASG continues to deliver the strongest medium-horizon profile of the diversified benchmarks.
Systematic Momentum CTA Index
The Systematic Momentum CTA Index returned 0.3% in May and is at 8.0% year to date, the lowest in the comparison. The Last 12 Months reading of 19.8% and the Last 2 Years return of 0.9% place it at the lower end of the medium-horizon tables. With 163 constituents, the index carries by far the broadest sampling of the systematic momentum universe across the seven, and that breadth is the proximate driver of both the lower volatility and the constrained upside capture relative to the trend-specific benchmarks. The May result reflects the same dynamic as the broader peer set: a fractured environment with little persistent direction left almost nothing for any construction to capture.
May Market Narrative
May 2026 was a month in which markets moved sharply but rarely trended. The TTU Trend Barometer traced the sequence 43, 57, 45, 32 across the four weeks, ending the month inside Weak-environment territory for the first time in the current sequence after repeatedly testing the Neutral and Strong thresholds from below. The dominant driver was energy: the Iran and Strait of Hormuz cycle alternated between escalation and de-escalation almost weekly, sending the petroleum complex through two-direction swings that no trend-following horizon could capture cleanly. The one persistent trend of the month sat in equities, where the S&P 500 logged consecutive weekly gains to fresh records and the VIX drained steadily lower. By the final week, sector after sector had resolved into two-way internal splits, and the barometer’s break below 40 confirmed what the compressed index returns already showed.
Week ending 8 May: Energy reverses and the barometer slips to Neutral
The first full week of May inverted the directional alignment that had closed April. Energy reversed hard, the sector averaging -3.72% with all six contracts lower in unison for the first time in the cycle, as diplomatic developments around the Strait of Hormuz reduced the geopolitical risk premium that had supported crude through the prior fortnight. WTI fell 6.40% and Brent 6.36%. Reports indicated the US administration had advanced a de-escalation framework via Pakistani intermediaries, with the previously announced naval operation halted mid-week. Equity indices led the upside at +2.46%, the Nikkei 225 surging 7.15% as it reopened from Japan’s Golden Week holiday and re-priced three sessions in one, with the Nasdaq 100 and S&P 500 both printing records on AI-driven strength. Metals recovered +2.29% as the corrective phase resolved upward. The barometer broke from 55% to 43%, a 12-point drop and the largest single-week decline to that point in the cycle, shifting the classification from Strong back to Neutral. The SG Trend Index slipped to -0.61% MTD and back below the double-digit YTD threshold it had reclaimed at April’s close.
Week ending 15 May: Energy rebounds and the hawkish Fed repricing
The second week reversed the first. Energy surged +5.70% with five of six contracts higher, WTI advancing 10.80%, after the administration rejected the de-escalation framework and signalled a tougher posture toward Iran, repricing the supply-disruption premium straight back into the complex. The broader regime signal came from the Federal Reserve. April CPI printed at 3.8% year over year, exceeding consensus, and PPI logged its largest single-month spike since early 2022. The path to a 2026 rate cut was repriced toward zero, with markets beginning to price a chance of a December hike, and the two-year Treasury yield climbed to a 14-month high. The week also marked the formal expiry of Jerome Powell’s term, with the Fed appointing him chair pro tempore pending the swearing-in of Kevin Warsh, already confirmed by the Senate as the more hawkish successor. The cross-asset response was unusually clean: the dollar advanced 1.46% with all seven counter-currencies lower, Metals fell 3.02% with all five lower in unison, Bonds sold off 1.33% across the curve, and Equities reversed to -1.19%. The barometer rebounded from 43% to 57%, the largest single-week rise of the cycle, lifting the classification back to Strong. The SG Trend Index climbed to +2.13% MTD and +12.48% YTD.
Week ending 22 May: De-escalation reverses energy again
The third week inverted the second. The administration called off imminent strikes early in the week to allow further negotiation, and the petroleum complex repriced the supply premium back out: Energy averaged -3.30% with five of six contracts lower, Gasoline RBOB leading the sector down. The diplomatic walk-back simultaneously released risk appetite. Equity indices averaged +2.40% with all seven contracts higher, the S&P 500 logging its eighth consecutive weekly gain, the European indices advancing more than 3.6%, and the VIX collapsing 10.25%, the largest single-asset move of the week. Metals extended a second weak week at -1.70%, and the cattle complex reversed cleanly to -3.17%, its first synchronised setback in several weeks. The barometer slipped from 57% to 45%, back into Neutral, with the rate of change reversing to Falling Moderately. The five-week sequence had now traced the Strong threshold four times in five weeks without consolidating on either side of it. The SG Trend Index eased to +1.19% MTD and +11.44% YTD, framing the fortnight as round-trip volatility rather than a directional shift.
Week ending 29 May: The petroleum unwind and the break to Moderately Weak
The final week extended the prior week’s direction rather than inverting it, but the internal structure deteriorated further. The petroleum complex fell for a second consecutive week as market pricing reflected returning Middle East production and normalising Hormuz traffic: Brent dropped 11.13% and WTI 9.57%. Natural Gas broke the opposite way, rising 8.90% on a bullish shift in summer cooling-demand forecasts, leaving Energy split internally and down 5.12% at the sector level. The risk tape held firm, with the S&P 500 logging its ninth consecutive weekly gain to a fresh record and the VIX falling a further 9.95%. Beneath the surface, the fracturing spread: Grains reversed down 1.12% after six consecutive positive weeks, splitting into oilseeds-up against grains-down, and Soft commodities split between a Cocoa bounce and an Orange Juice collapse. Bonds firmed 0.71% as April PCE printed slightly soft and Q1 GDP was revised lighter, and the dollar extended lower. The barometer dropped from 45% to 32%, out of Neutral and into Moderately Weak, breaking below the 40% boundary for the first time in the sequence with the rate of change accelerating to Falling Rapidly. The SG Trend Index closed the month near +0.38% MTD and +10.55% YTD, having given back the bulk of the gain it built mid-month.
Implications for Index Construction and May Capture
The energy complex was the proximate cause of the month, and the way it defeated trend capture is more instructive than the size of its moves. Brent reversed direction in three of the four weeks, near 100, then 109, then 103, then 92, and each reversal invalidated the one before it before any trend-following horizon could fully exploit it. A system that re-established long exposure on the mid-month rebound was selling it back a week later; a system that flipped short on the decline was caught by the next bounce. The simultaneous Natural Gas spike on a weather-forecast shift confirmed the sector had stopped trending as one. Headline-driven, two-direction movement of this kind penalises single-sector conviction and rewards bidirectional capacity, which is part of why the diversified blends held the top of the shorter-horizon tables while the concentrated benchmarks merely held their ground.
The cleaner opportunity sat where movement was consistent rather than spiky. The equity advance ran for the full month, the VIX drained lower in a clean multi-week trend, and the dollar and the long end of the curve moved with the softening inflation impulse into month-end. These were the few places persistence survived, and the systems with the horizon and the cross-sector breadth to hold them through the energy noise captured the month’s best contributions. The reward went not to the boldest directional view but to the steadiest one.
Closing Reflection
May produced the narrowest dispersion of the year and the first barometer reading inside Weak-environment territory in the current sequence. Classic Trend led the field for a second month, but by a margin that says more about the scarcity of opportunity than the presence of an edge. SG CTA leads the year-to-date and trailing-quarter tables; Classic Trend leads every long-horizon and risk-adjusted measure and has now taken the Last 12 Months lead as well. The standings barely moved, because the month barely offered anything to move them.
The more useful lesson sits underneath the numbers. Trend followers are conditioned to fear losing months, but a month like May is the more revealing test. Markets moved violently from the first week to the last, and almost none of that movement persisted long enough to be captured. Volatility was everywhere and opportunity was scarce, because the two are not the same thing. Persistence, not movement, is the raw material from which trend-following returns are built, and in May it was the rarest commodity in the market. That, more than any single index result, is what the month had to teach.
About the Indexes
- SG Trend Index
Created by Société Générale, the SG Trend Index represents the largest trend-following CTA programs, focusing on systematic strategies with significant AUM. It captures broad market movements across various assets. More on SG Trend Index - Barclay BTOP50 Index
Managed by BarclayHedge, this index follows the largest investable CTAs, emphasizing diversification across major futures markets. It’s a widely referenced benchmark for managed futures. More on BTOP50 Index - TTU Trend Following Index
Developed by Top Traders Unplugged, the TTU TF Index includes programs with a 15-year track record, emphasizing resilience through experience and diversification across a large ensemble of programs. More on TTU TF Index - SG CTA Index
Another index by Société Générale, the SG CTA Index covers a broader array of CTA strategies, providing insight into the managed futures landscape beyond trend following alone. More on SG CTA Index - IASG Trend Following Index
This index, managed by IASG, tracks CTAs that primarily use trend-following strategies, offering a focused benchmark within the managed futures space. More on IASG TF Index - Classic Trend Index
The Classic Trend Index, curated by the Aussie Turtles, is a benchmark for traditional trend-following strategies, focusing on consistent, systematic approaches across diversified asset classes. More on Classic Trend Index - Systematic Momentum CTA Index
Managed by NilssonHedge, this index tracks CTAs focused on momentum-based strategies, providing a purist view of momentum trading within managed futures. More on Systematic Momentum CTA Index
Stay tuned for next month’s Battle of the Trend Following Indexes to see which benchmarks emerge as the top performers in the trend-following landscape.
Get the Aussie Turtles® Trend Following Guide
If you want to go deeper into the principles behind trend following and build a process that survives real market conditions, the Aussie Turtles® Trend Following Guide is now available on Amazon.
This book is a field manual for traders who want to move beyond prediction and commit to disciplined, systematic practice. Written by Adam Havryliv and Richard Brennan, it distills decades of experience into a practical and philosophical framework for navigating complex markets.
The guide challenges the myths of consistency and control. It explains why markets evolve through trader impact, serial correlation, and emergent structure rather than forecasts. It does not promise a holy grail system. Instead, it teaches the mindset required to capture the rare asymmetric outliers that drive long term performance.
If you are ready to trade with clarity, resilience, and conviction, this is the place to start. Click on the image below.