Battle of the Trend Following Indexes: April 2025
In the Battle of the Trend Following Indexes, we present a monthly update on some of the most respected trend-following benchmarks.
April 2025 Result
April was a bruiser.
The trend-following battlefield offered no shelter this month, as losses hit across the board. After the setbacks of Q1, April brought more pain — with all seven tracked indexes ending the month in the red. The volatility was real, but directional conviction remained elusive. For models primed to ride waves, April gave only chop.
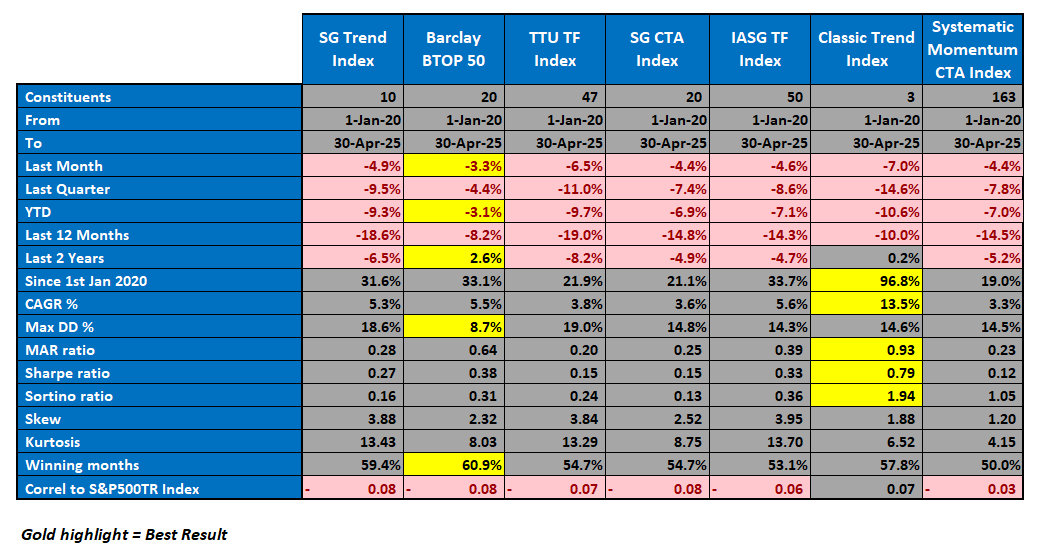
Once again, the Classic Trend Index took the biggest hit — down -7.0% for the month and now -10.6% YTD — but it still towers over the field in long-term performance. Its CAGR of 13.5% and stellar MAR ratio of 0.93 are unmatched, a testament to trend purity and process integrity.
Performance Highlights
April compounded the losses from Q1, dragging every major trend benchmark into deeper YTD territory. While the Barclay BTOP50 Index again proved most defensive with a -3.3% decline, even it couldn’t escape unscathed.
Here’s how each index fared in April:
Classic Trend Index: Fell -7.0% in April and is now down -10.6% YTD. Despite the pain, it remains the undisputed long-term leader with a CAGR of 13.5%, Sharpe ratio of 0.79, Sortino of 1.94, and a total return of 96.8% since Jan 2020. Its MAR of 0.93 reflects exceptional resilience through the cycle.
SG Trend Index: Dropped -4.9% in April and -9.3% YTD. Over the last 12 months, it’s down -18.6%. While its CAGR of 5.3% is respectable, a max drawdown of 18.6% weighs heavily on its MAR ratio (0.28).
Barclay BTOP50: The best relative performer again in April, down -3.3% for the month. It leads YTD with a comparatively shallow -3.1% decline and has the lowest drawdown (8.7%) across all benchmarks. Its long-term CAGR of 5.5% and Sharpe of 0.38 affirm its defensive profile.
TTU Trend Following Index: Suffered a -6.5% loss in April, extending its YTD decline to -9.7%. Its CAGR of 3.8% and drawdown of 19.0% leave it struggling in risk-adjusted terms (MAR ratio: 0.20), though its diversified multi-manager nature still offers signal diversity.
SG CTA Index: Down -4.4% in April and -6.9% YTD. A lower-volatility player with a 3.6% CAGR and 14.8% max drawdown, its MAR ratio sits at 0.25, reflecting middling efficiency in recent years.
IASG Trend Following Index: Declined -4.6% in April, bringing YTD losses to -7.1%. It maintains a solid long-term CAGR of 5.6% with a relatively balanced Sharpe of 0.33, though it too has been hit hard in the last 12 months (-14.3%).
Systematic Momentum CTA Index: Fell -4.4% in April, now down -7.0% YTD and -14.5% over the last 12 months. Its 3.3% CAGR and 14.5% max drawdown give it a MAR ratio of 0.23 — a tough period for pure momentum systems.
Performance Snapshot
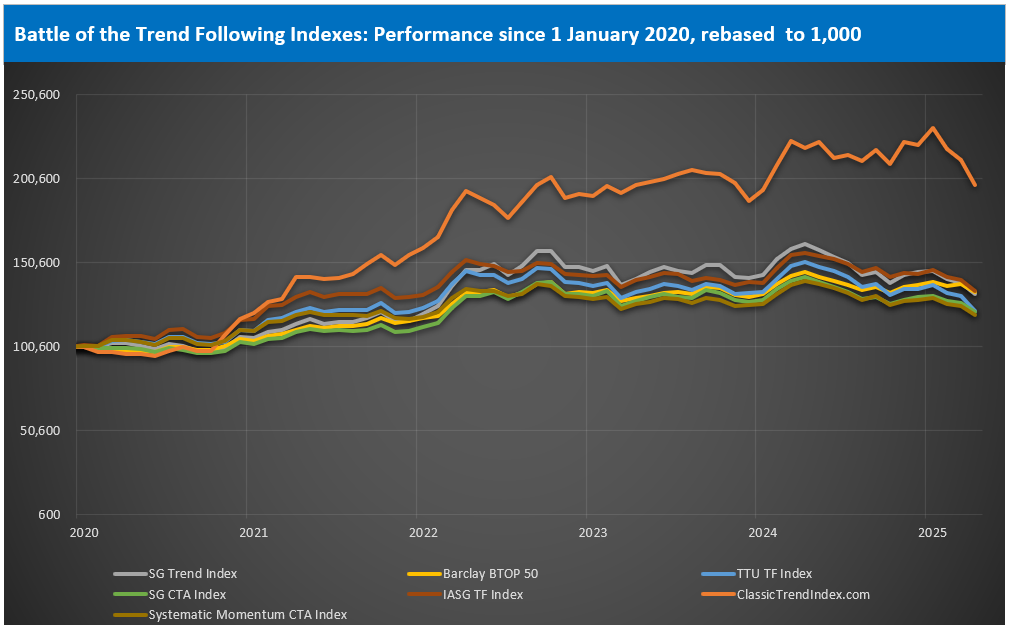
The VAMI chart continues to tell a clear story. Despite the recent decline, the Classic Trend Index retains its dominant long-term position — nearly doubling since January 2020. The remaining benchmarks remain tightly packed, reflecting similar performance profiles over time.
The April data reinforce a familiar truth: while defensive indexes like Barclay BTOP50 may hold ground in choppy conditions, they don’t capture the same upside in trending environments. Classic Trend’s volatility may sting, but its edge over time remains unmistakable.
Statistical Table
The table reveals clustering among most indexes, both in terms of long-term CAGR (3.3% to 5.6%) and drawdown profiles. However, Classic Trend breaks this mold:
Best CAGR: Classic Trend Index – 13.5%
Best Sharpe/Sortino: Classic Trend Index – 0.79 / 1.94
Best MAR Ratio: Classic Trend Index – 0.93
Best Drawdown Profile: Barclay BTOP50 – 8.7%
Most Winning Months: Barclay BTOP50 – 60.9%
While April was painful across the board, the dispersion in quality is clear when you look beyond the month-to-month chop. The signal is in the stats.
April Reflections
April tested every model’s ability to endure, adapt, and stay the course. No index was spared. And yet, even in this red sea, the message is consistent: edge is long-term.
The Classic Trend Index, built on traditional trend principles and unrelenting systematic discipline, may have taken a blow, but it remains structurally sound — with the strongest return profile and best risk-adjusted performance of the group.
“It’s not the smoothest ride that wins. It’s the one still standing at the end of the storm.”
About the Indexes
- SG Trend Index
Created by Société Générale, the SG Trend Index represents the largest trend-following CTA programs, focusing on systematic strategies with significant AUM. It captures broad market movements across various assets. More on SG Trend Index - Barclay BTOP50 Index
Managed by BarclayHedge, this index follows the largest investable CTAs, emphasizing diversification across major futures markets. It’s a widely referenced benchmark for managed futures. More on BTOP50 Index - TTU Trend Following Index
Developed by Top Traders Unplugged, the TTU TF Index includes programs with a 15-year track record, emphasizing resilience through experience and diversification across a large ensemble of programs. More on TTU TF Index - SG CTA Index
Another index by Société Générale, the SG CTA Index covers a broader array of CTA strategies, providing insight into the managed futures landscape beyond trend following alone. More on SG CTA Index - IASG Trend Following Index
This index, managed by IASG, tracks CTAs that primarily use trend-following strategies, offering a focused benchmark within the managed futures space. More on IASG TF Index - Classic Trend Index
The Classic Trend Index, curated by the Aussie Turtles, is a benchmark for traditional trend-following strategies, focusing on consistent, systematic approaches across diversified asset classes. More on Classic Trend Index - Systematic Momentum CTA Index
Managed by NilssonHedge, this index tracks CTAs focused on momentum-based strategies, providing a purist view of momentum trading within managed futures. More on Systematic Momentum CTA Index
Stay tuned for next month’s Battle of the Trend Following Indexes to see which benchmarks emerge as the top performers in the trend-following landscape.