Battle of the Trend Following Indexes: April 2026
The Battle of the Trend Following Indexes provides a monthly snapshot of the leading trend-following benchmarks. All figures reflect performance through 30 April 2026, with index histories rebased to 1,000 on 1 January 2020.

April 2026 Result
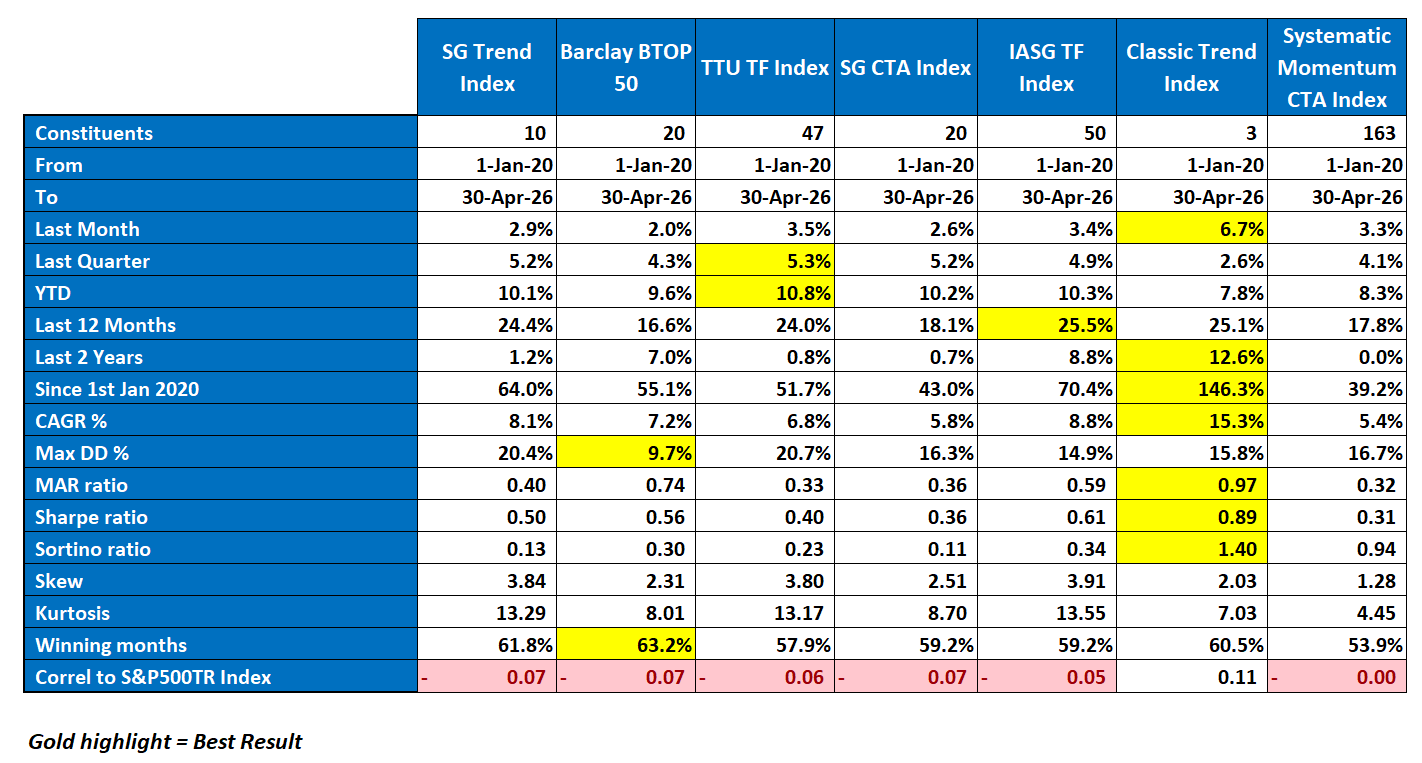
Classic Trend Index gained +6.7% in April, leading every peer in the comparison and posting roughly twice the return of the next-best index. The TTU Trend Following Index returned +3.5%, the IASG Trend Following Index returned +3.4%, and the Systematic Momentum CTA Index returned +3.3%. The SG Trend Index posted +2.98%, the SG CTA Index +2.6%, and the Barclay BTOP50 +2.0%. Every index in the comparison finished April in positive territory. The dispersion is the story.
April was the strongest single trend-following month of 2026 to date across the broader systematic universe. The SG Trend Index closed April at +2.98% for the month and +10.27% year-to-date, the first double-digit YTD reading of the year. Three of the seven indexes in this comparison are now into double-digit YTD territory: TTU at 10.8%, IASG at 10.3%, and SG Trend at 10.1%. Classic Trend Index sits at 7.8% YTD, still rebuilding from its March drawdown.
That last point matters for honesty. Classic Trend’s +6.7% April is the largest single-month gain across the seven indexes, but its Last Quarter return of +2.6% is the lowest. The April recovery has not yet erased the March cost, and the quarter-on-quarter picture confirms that. The Last 12 Months reading places Classic at +25.1%, essentially tied with IASG at +25.5% and ahead of SG Trend at +24.4%, which is where the index is most directly compared on a like-for-like horizon.
Across the longer-horizon and risk-adjusted metrics, Classic Trend continues to lead the comparison: Last 2 Years +12.6%, Since 1 Jan 2020 +146.3%, CAGR 15.3%, MAR 0.97, Sharpe 0.89, and Sortino 1.40. The Barclay BTOP50 retains the lowest maximum drawdown at 9.7%, against Classic Trend’s 15.8%. These structural readings have not moved materially since March; April has reinforced rather than altered them.
The market context for the month was a five-week round trip in the trend environment itself. The TTU Trend Barometer traced the sequence 66, 55, 48, 55, 50, 55 across the weeks, finishing April back on the Neutral/Strong threshold it printed at the start. The path included a tariff-driven energy and metals spike, a ceasefire-driven reversal, a Hormuz reopening that pushed oil sharply lower, a Hormuz re-closure that drove petroleum back up, and a final week in which all six energy contracts moved higher in unison for the first time in the cycle. Metals reversed in late April after three weeks of uniform strength. The cycle ended with cleaner directional alignment than it had carried through any prior week of the month.
Classic Trend’s monthly result is consistent with what a high-convexity, leveraged design is expected to deliver in a month that ends with directional alignment after fortnight-long disruption. The same design that produced March’s underperformance produced April’s outperformance. The peers, with lower convexity and more diversified construction, captured a steadier but smaller share of the same underlying directional moves. That is the trade-off in its working form, and the convexity spectrum is a matter for each allocator’s own judgement.
Performance Highlights
Here is how the indexes performed in April:
Classic Trend Index
+6.7% for April, the deepest monthly gain among the seven benchmarks. Trailing quarter +2.6%. YTD +7.8%. Since January 2020 the index has gained 146.3% with a 15.3% CAGR. Classic Trend retains leadership across long-term risk-adjusted measures with a MAR of 0.97, a Sharpe of 0.89, and a Sortino of 1.40. The same three-constituent, leveraged construction that absorbed the March repricing captured the April recovery. The 6.7% single-month result is consistent with the convexity profile the index has carried throughout its history: months of largest gain and months of largest drawdown both originate in the same concentrated design.
Barclay BTOP50 Index
+2.0% for April, the smallest monthly result among the seven benchmarks. Trailing quarter +4.3%. YTD +9.6%. Since 2020 the index has gained 55.1% with a 7.2% CAGR and the lowest drawdown of the group at 9.7%. With the highest proportion of winning months at 63.2%, BTOP50 once again demonstrated the value of its defensive profile. The modest April gain extended the year-to-date result toward the double-digit threshold without taking on additional volatility, and the index remains a textbook example of how volatility-targeted, diversified exposures deliver smoother equity curves through both reversal and trending months.
SG Trend Index
+2.98% for April and +5.2% for the trailing quarter. YTD +10.1%. Since 2020 the index is up 64.0% with an 8.1% CAGR and a 20.4% drawdown. The large-programme trend benchmark crossed into double-digit YTD territory for the first time in 2026. The gains accumulated in the second half of the month, once the energy whipsaw began to resolve, with the index moving from -0.15% MTD at the end of week one to +2.98% at month-end. The path reflects the systematic re-engagement that follows once directional alignment re-establishes itself after a disruptive period.
SG CTA Index
+2.6% for April and +5.2% for the trailing quarter. YTD +10.2%. Since 2020 the index is up 43.0% with a 5.8% CAGR and a 16.3% drawdown. The broader CTA blend’s diversified strategy mix delivered a result in line with the trend-focused peers, with the breadth of construction capturing the directional alignment of the late-month period without the concentration premium of the more focused trend benchmarks.
TTU Trend Following Index
+3.5% for April and +5.3% for the trailing quarter. YTD +10.8%, the lead position in the year-to-date table, and Last Quarter +5.3%, also the lead. Since 2020 the index has gained 51.7% with a 6.8% CAGR and a 20.7% drawdown. The 47-program ensemble’s breadth captured the April directional alignment effectively, and the index’s leadership across the YTD and Last Quarter tables reflects the consistency of contribution across the constituent set through the disruptive intra-month path.
IASG Trend Following Index
+3.4% in April and +4.9% for the trailing quarter. YTD +10.3%. Since 2020 the index has gained 70.4% with an 8.8% CAGR and a 14.9% drawdown. IASG TF retains its leadership across the trailing twelve-month window at +25.5%, narrowly ahead of Classic Trend at +25.1%, and continues to demonstrate one of the best growth-to-drawdown profiles among the seven benchmarks. The Last 2 Years return of 8.8% places it second behind Classic Trend.
Systematic Momentum CTA Index
+3.3% in April and +4.1% for the trailing quarter. YTD +8.3%. Since 2020 the index has gained 39.2% with a 5.4% CAGR and a 16.7% drawdown. The broad 163-constituent momentum benchmark delivered a middle-of-the-pack monthly result, with the diversification across a very large number of programs producing a smooth but constrained capture of the late-month directional alignment.
Performance Snapshot
The table below presents the comparative statistics for the seven trend-following indexes through 30 April 2026. Gold-highlighted cells indicate the best result in each row.
Performance Since 1 January 2020
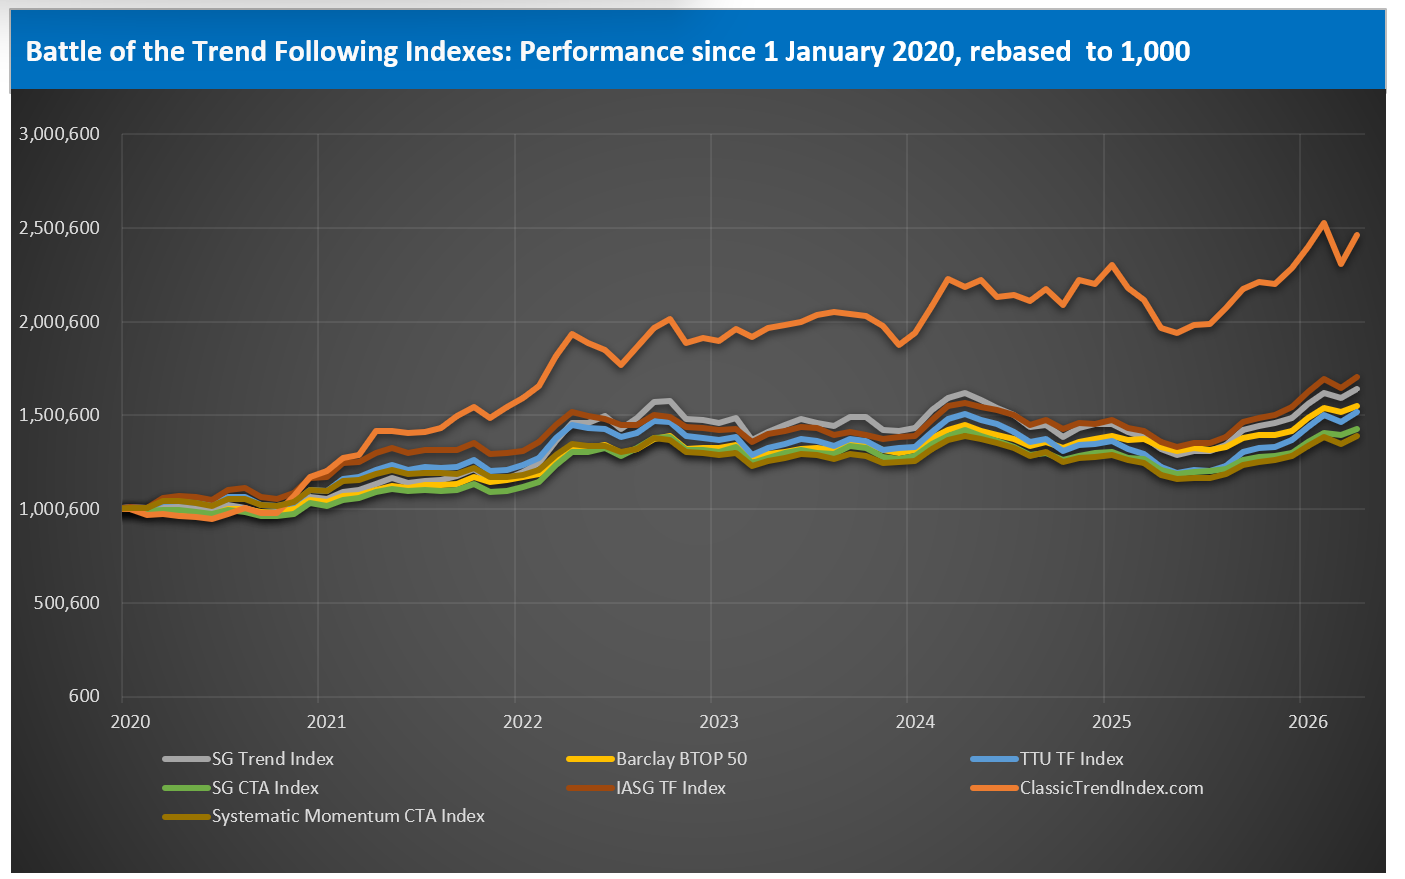
The chart below shows the value-added monthly index (VAMI) for each of the seven indexes, rebased to 1,000 on 1 January 2020. The Classic Trend Index remains substantially ahead of the peer group on a since-inception basis.
Performance Commentary
Classic Trend Index
Classic Trend gained 6.7% in April, the largest single-month return across the seven indexes and roughly twice the return of the next-best peer. The structural readings underlying the index have not moved materially since March; the April result reinforces rather than alters them. The index closes April with a 7.8% year-to-date reading, still below the TTU, IASG, and SG Trend Index peers, all of which sit above 10%. The Last Quarter return of 2.6% is the lowest in the comparison, reflecting that the March drawdown has not yet been fully recovered. Across the longer-horizon metrics, the Last 2 Years return at 12.6% is roughly 3.8 percentage points ahead of IASG, the second-place peer. Since 1 January 2020, the index has returned 146.3%, against 70.4% for IASG and 64.0% for SG Trend. The MAR ratio at 0.97, Sharpe at 0.89, and Sortino at 1.40 are each best-in-class within the comparison. The maximum drawdown of 15.8% is the second-lowest across the seven indexes; Barclay BTOP50 holds the lowest at 9.7%. The 6.7% month is consistent with the convexity profile the index has carried throughout its history: months of largest gain and months of largest drawdown both originate in the same leveraged, concentrated construction.
Barclay BTOP50 Index
The Barclay BTOP50 returned 2.0% in April, the smallest single-month return in the comparison. The year-to-date reading sits at 9.6%, with a Last 12 Months return of 16.6% and a Last 2 Years return of 7.0%. The index continues to occupy its established role within the comparison: lower monthly volatility, lower drawdown, and lower upside capture during pronounced trend months. The maximum drawdown of 9.7% remains the best in the comparison, and the winning months reading of 63.2% is the highest. The MAR ratio at 0.74 ranks second behind Classic Trend. The diversified, lower-concentration construction underlying the BTOP50 components is doing exactly what it is designed to do in a month of cross-sector whipsaw followed by late-month directional alignment: capture a steady but limited portion of the underlying move.
SG Trend Index
The SG Trend Index returned 2.98% in April and now sits at 10.1% year-to-date. The Last 12 Months reading of 24.4% is just behind the IASG and Classic Trend Index figures, and the Last Quarter return of 5.2% is comfortably mid-pack. The index has been the consistent reference for trend-following performance through 2026 and remains the steadiest of the comparison. The week-by-week MTD reading across April moved from -0.15% at the end of week one, to +0.08% at week two, +0.87% at week three, +1.54% at week four, and a final close of +2.98%. The gains accumulated in the second half of the month, once the energy whipsaw began to resolve.
SG CTA Index
The SG CTA Index returned 2.6% in April and is at 10.2% year-to-date. The Last 12 Months return of 18.1% sits below the trend-focused peers, reflecting the broader systematic construction underlying the SG CTA versus the more concentrated trend signals captured by the SG Trend Index. The Last 2 Years return of 0.7% is the lowest across the seven indexes, with the corresponding Sharpe and Sortino readings also at the lower end of the comparison. The index continues to deliver the most diversified systematic exposure within the seven, with the broader factor set diluting both upside and downside capture against the trend-specific reference points.
TTU Trend Following Index
The TTU Trend Following Index returned 3.5% in April, the second-largest gain in the comparison, and now leads the year-to-date table at 10.8% and the Last Quarter table at 5.3%. The Last 12 Months reading of 24.0% sits roughly in line with SG Trend. The 47 underlying constituents provide a broader sampling of the trend-following manager universe than the 20-component SG Trend Index. The April reading reflects the broader directional alignment of the late-month period combined with the reasonable diversification of the constituent set. The maximum drawdown of 20.7% is the highest in the comparison, and the Sharpe at 0.40 sits at the lower end, reflecting the trade-off in carrying a broader, higher-volatility constituent set.
IASG Trend Following Index
The IASG Trend Following Index returned 3.4% in April and is at 10.3% year-to-date. The Last 12 Months return of 25.5% is the highest in the comparison, narrowly ahead of Classic Trend at 25.1%. The Last 2 Years return of 8.8% sits second behind Classic Trend, and the Since 1 January 2020 return of 70.4% places it second in the long-horizon stakes. The MAR ratio of 0.59 and Sharpe of 0.61 are competitive within the comparison. With 50 constituents, the IASG index provides the second-broadest sampling of the trend-following manager universe and consistently delivers the strongest peer-relative result outside of Classic Trend across the medium-horizon metrics.
Systematic Momentum CTA Index
The Systematic Momentum CTA Index returned 3.3% in April and is at 8.3% year-to-date. The Last 12 Months reading of 17.8% is the second-lowest in the comparison, and the Last 2 Years return of 0.0% places it at the floor of the medium-horizon table alongside SG CTA. With 163 constituents, the index carries by far the broadest sampling of the systematic momentum universe across the seven, and the breadth of construction is the proximate driver of both the lower volatility and the lower upside capture relative to the trend-specific indexes. The April result reflects the same dynamic as the broader peer set: directional alignment in the final fortnight of the month produced the bulk of the monthly gain.
April Market Narrative
April 2026 was the strongest single trend-following month of the year to date, with the SG Trend Index gaining 2.98% for the month and crossing into double-digit territory year-to-date for the first time in 2026. The headline result, however, conceals a remarkably disruptive intra-month path. The TTU Trend Barometer traced the sequence 66, 55, 48, 55, 50, 55 across the five weeks of the period, executing a full round trip back to the Neutral/Strong threshold where it began. Two sectors, energy and precious metals, reversed direction multiple times across the month. The headline returns were captured largely in the final fortnight, once the directional alignment that had been disrupted by the Hormuz standoff began to resolve.
Week 1: Tariff shock and the commodity explosion
The week ending 3 April delivered one of the most extraordinary single-week commodity performances in the current dataset. Crude Oil WTI surged 18.06%, the largest single-week move across the 49-asset universe. Palladium gained 11.02%, Orange Juice 10.53%, Silver 7.35%, Gold 6.16%, and every metals contract finished higher. The trigger was the one-year anniversary of the April 2025 Liberation Day tariff announcements, with the administration signing fresh executive orders adjusting duties on metals and pharmaceuticals. Equity indices reversed sharply higher across all seven markets, averaging +2.87%. The TTU Trend Barometer fell from 66% to 55% despite the magnitude of the gains: the violent multi-sector repricing disrupted established trend signals even as it delivered exceptional raw performance. The week’s most important signal was the gap between the headline numbers and the barometer reading.
Week 2: The ceasefire reversal
The week ending 10 April fully reversed the prior week’s energy move. Crude Oil WTI fell 13.42%, Brent fell 12.68%, and Heating Oil fell 13.75% as markets priced out part of the Gulf supply-shock premium on ceasefire optimism ahead of weekend U.S.-Iran talks. Equity indices delivered their strongest sector week in the dataset, averaging +4.31%. Bitcoin surged 9.46%, the best single-asset performer of the week. The barometer fell further from 55% to 48%, dropping into deeper Neutral territory with a 10-day rate of change of Falling Rapidly. The two-week round trip in petroleum, with WTI surging 18% then falling 13%, was the textbook signature of a market in which fundamentals and politics pull in opposite directions and signal quality deteriorates with each reversal.
Week 3: Hormuz reopens and the trend cycle re-engages
The week ending 17 April saw a violent repricing of geopolitical risk in the opposite direction to week 1. Iran’s declaration that the Strait of Hormuz was open to commercial shipping stripped out the remaining supply-shock premium. OPEC cut its Q2 2026 demand forecast by 500,000 barrels per day on war-related damage, shifting market focus to softer demand. Crude Oil WTI fell 11.24%, the worst single-week performer across the 49 assets. The U.S. dollar slipped to multi-week lows. Silver led all 49 assets at +7.01% and the precious metals complex extended its uniform-direction advance for a third consecutive week. The Nasdaq 100 gained 6.11% and the Russell 2000 hit a record high. The barometer cleared from 48% to 55%, crossing back into the Strong trend band for the first time since the early-April decline.
Week 4: Hormuz re-closes and the metals correction
The week ending 24 April reversed the week-3 narrative as fully as week 2 had reversed week 1. The Strait of Hormuz remained effectively closed to commercial flows, the U.S. naval blockade of Iranian ports held, and diplomatic progress stalled. Brent advanced 16.54%, Gasoline RBOB 15.24%, Heating Oil 14.42%, and Crude Oil WTI 14.30%. Energy averaged +9.45%, the largest single-week sector swing in the current comparison. Metals reversed in the opposite direction, with Silver -6.63%, Palladium -5.68%, Platinum -5.20%, and the sector averaging -4.36% after three consecutive weeks of unidirectional upside. The U.S. dollar firmed, Treasury yields rose, and European equities moved lower on energy import bill concerns. The barometer eased from 55% to 50% but the Strong classification held. The SG Trend Index nonetheless set fresh 2026 highs at +1.54% MTD and +8.73% YTD.
Week 5: The cycle reasserts itself
The final week of the month resolved the question that the prior fortnight had left open. Energy extended for a second week with all six contracts moving higher in unison for the first time in the current cycle: Brent +10.67%, WTI +7.99%, Gasoline RBOB +7.75%, Heating Oil +4.03%, Natural Gas +3.62%, Ethanol +2.07%. The sector averaged +6.02%, converting the prior week’s spike-and-reverse pattern into a spike-and-extend pattern. Soft commodities reversed sharply higher after three negative weeks, with Orange Juice +16.85% the largest single-asset move of the week. Metals consolidated rather than extended their decline, with the magnitude shrinking from -4.36% to -0.57% and the breadth fracturing. The barometer recovered from 50% to 55%, reclaiming the Neutral/Strong threshold. The SG Trend Index closed April at +2.98% for the month and +10.27% YTD, both fresh 2026 highs.
Implications for Index Construction and April Capture
The dispersion of monthly returns across the seven indexes ranged from 2.0% at the Barclay BTOP50 to 6.7% at the Classic Trend Index, a spread of 4.7 percentage points. The drivers of that dispersion appear to be three: position concentration, leverage, and the sensitivity of constituent strategies to the timing of directional resolution in the late-month period.
Indexes carrying broader, more diversified constituent sets (Systematic Momentum at 163, IASG at 50, TTU at 47, BTOP50 at 20) tend to deliver more stable readings across consecutive months. Concentrated, higher-conviction constructions (Classic Trend at 3) deliver more variable readings, with the variance compounded by the leverage typical of high-convexity programmes. The April result for Classic Trend is the upside expression of that profile. The March result was the downside expression of the same profile. Neither result, in isolation, alters the structural read on the construction.
The capture of the late-month directional alignment in energy and soft commodities was the proximate driver of the April dispersion. Systems that maintained or rebuilt long energy exposure through the week-2 and week-3 reversals captured the week-4 and week-5 advance. Systems that flipped to short energy on the week-3 Hormuz decline sat on the wrong side of the week-4 spike. The same logic applies in metals, in opposite direction: systems that had built long metals exposure through the three weeks of uniform strength gave back through the week-4 correction. The cleanest April result therefore belonged to systems whose trend-following horizon matched the actual persistence of the underlying moves, with horizons too short whipsawed by the Hormuz reversals and horizons too long pulled into the metals correction.
Closing Reflection
April 2026 produced the strongest single trend-following month of the year, the first double-digit YTD reading for the SG Trend Index, and a dispersion across the seven peer indexes that ranged from 2.0% to 6.7%. The Classic Trend Index led the comparison by a margin of roughly two-to-one over the next-best peer, but the year-to-date table continues to be led by TTU, IASG, and SG Trend on absolute terms. The Last Quarter table is led by TTU. The long-horizon and risk-adjusted tables continue to be led by Classic Trend across CAGR, MAR, Sharpe, Sortino, and total return since 1 January 2020.
The most honest summary of the April result is that the convexity of Classic Trend’s construction, which produced the underperformance in March, produced the outperformance in April. The same design feature ran in both directions across consecutive months. The peers, with lower-convexity and more diversified construction, captured a smaller share of both the downside and the upside. Across a full cycle, the long-horizon metrics suggest the higher-convexity profile has delivered superior compound returns. Across any individual month or quarter, the same profile delivers materially wider variance. The selection of one approach over the other is, as ever, a matter for each allocator’s own judgement on the convexity spectrum.
About the Indexes
- SG Trend Index
Created by Société Générale, the SG Trend Index represents the largest trend-following CTA programs, focusing on systematic strategies with significant AUM. It captures broad market movements across various assets. More on SG Trend Index - Barclay BTOP50 Index
Managed by BarclayHedge, this index follows the largest investable CTAs, emphasizing diversification across major futures markets. It’s a widely referenced benchmark for managed futures. More on BTOP50 Index - TTU Trend Following Index
Developed by Top Traders Unplugged, the TTU TF Index includes programs with a 15-year track record, emphasizing resilience through experience and diversification across a large ensemble of programs. More on TTU TF Index - SG CTA Index
Another index by Société Générale, the SG CTA Index covers a broader array of CTA strategies, providing insight into the managed futures landscape beyond trend following alone. More on SG CTA Index - IASG Trend Following Index
This index, managed by IASG, tracks CTAs that primarily use trend-following strategies, offering a focused benchmark within the managed futures space. More on IASG TF Index - Classic Trend Index
The Classic Trend Index, curated by the Aussie Turtles, is a benchmark for traditional trend-following strategies, focusing on consistent, systematic approaches across diversified asset classes. More on Classic Trend Index - Systematic Momentum CTA Index
Managed by NilssonHedge, this index tracks CTAs focused on momentum-based strategies, providing a purist view of momentum trading within managed futures. More on Systematic Momentum CTA Index
Stay tuned for next month’s Battle of the Trend Following Indexes to see which benchmarks emerge as the top performers in the trend-following landscape.
Get the Aussie Turtles® Trend Following Guide
If you want to go deeper into the principles behind trend following and build a process that survives real market conditions, the Aussie Turtles® Trend Following Guide is now available on Amazon.
This book is a field manual for traders who want to move beyond prediction and commit to disciplined, systematic practice. Written by Adam Havryliv and Richard Brennan, it distills decades of experience into a practical and philosophical framework for navigating complex markets.
The guide challenges the myths of consistency and control. It explains why markets evolve through trader impact, serial correlation, and emergent structure rather than forecasts. It does not promise a holy grail system. Instead, it teaches the mindset required to capture the rare asymmetric outliers that drive long term performance.
If you are ready to trade with clarity, resilience, and conviction, this is the place to start. Click on the image below.