Battle of the Trend Following Indexes: August 2025
In the Battle of the Trend Following Indexes, we present a monthly update on some of the most respected trend-following benchmarks. Figures reflect performance through 31 Aug 2025, with histories rebased to 1,000 on 1 Jan 2020.
August 2025 Result
Broad recovery, one index still towers above.
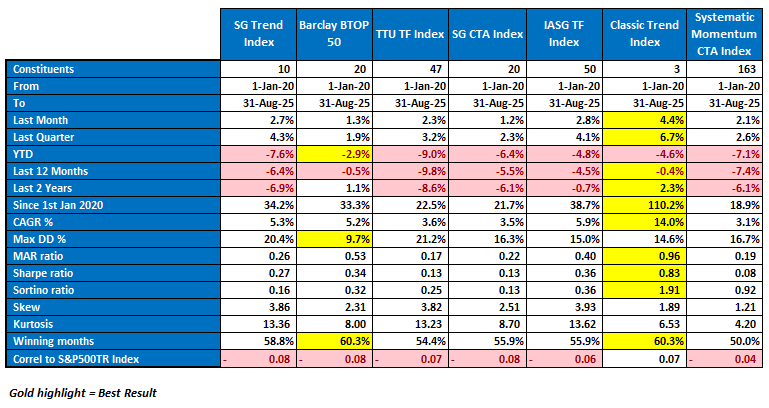
Every index closed August in the green. Classic Trend Index once again led the pack with +4.4%. IASG followed at +2.8%, SG Trend at +2.7%, TTU at +2.3%, Systematic Momentum at +2.1%, BTOP50 at +1.3%, and SG CTA at +1.2%.
Behind the bounce lies a broader market context: renewed commodity momentum, shifting FX trends, and volatility in fixed income gave systematic models a wider canvas to work with.
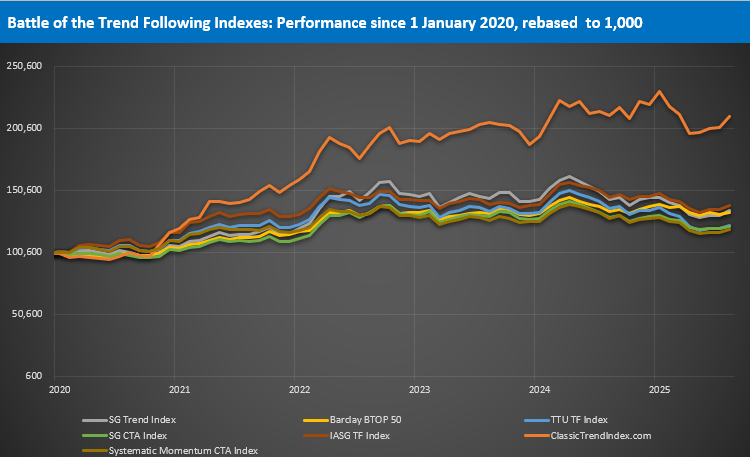
The longer arc remains clear. Classic Trend Index dominates at +110.2% since January 2020, running a 14.0% CAGR. The rest cluster tightly between +18.9% and +38.7% over the same span.
YTD numbers are still negative for all, from −2.9% (BTOP50) to −9.0% (TTU). Drawdowns tell the structural story: BTOP50 anchors with the shallowest max drawdown (9.7%), while Classic compounds strongly with moderate drawdowns (14.6%) and unmatched ratios.
Performance Highlights
Here’s how the indexes stacked up for June:
Classic Trend Index
+4.4% in August, +6.7% for the quarter. YTD −4.6% yet up +110.2% since 2020 with a 14.0% CAGR. It leads every risk-adjusted measure (MAR 0.96, Sharpe 0.83, Sortino 1.91) and is tied for the most winning months at 60.3%. Importantly, Classic has shown fast drawdown recovery, bouncing back far quicker than peers when markets re-align with trend. This resilience is the engine of its compounding edge.
IASG Trend Following Index
+2.8% for August, +4.1% for the quarter. YTD −4.8%. Since 2020, +38.7% (5.9% CAGR) with a 15.0% max drawdown. A steady mid-pack player with a balanced profile.
SG Trend Index
+2.7% for August, +4.3% for the quarter. YTD −7.6%, −6.4% over 12 months. Since 2020, +34.2% with a 5.3% CAGR, but a 20.4% drawdown limits efficiency.
TTU Trend Following Index
+2.3% in August, +3.2% for the quarter. YTD −9.0%, 12-month −9.8%. Since 2020, +22.5% (3.6% CAGR) with a 21.2% drawdown. A broad ensemble still struggling in trend-scarce conditions.
Systematic Momentum CTA Index
+2.1% in August, +2.6% for the quarter. YTD −7.1%, 12-month −7.4%. Since 2020, +18.9% (3.1% CAGR) with a 16.7% drawdown. Momentum purists remain out of sync despite the month’s gain.
Barclay BTOP50
+1.3% in August, +1.9% for the quarter. YTD −2.9% — best of the group. Since 2020, +33.3% (5.2% CAGR). The ballast index: lowest drawdown (9.7%) and tied for most winning months at 60.3%.
SG CTA Index
+1.2% for August, +2.3% for the quarter. YTD −6.4%, 12-month −5.5%. Since 2020, +21.7% (3.5% CAGR) with a 16.3% drawdown. A broader CTA blend that remains muted.
Performance Snapshot
The VAMI chart remains simple: Classic Trend Index towers at +110.2% since 2020. All others remain tightly grouped between +18.9% and +38.7%. Dispersion narrowed in August with universal gains, but the long-term spread remains vast.
Classic’s ability to recover from drawdowns faster than peers is what keeps its compounding edge intact. Where others remain underwater for extended periods, Classic claws back quickly, demonstrating the structural advantage of pure, diversified trend.
Statistical Highlights
Best CAGR: Classic Trend Index: 14.0%
Best MAR Ratio: Classic Trend Index: 0.96
Best Sharpe / Sortino: Classic Trend Index: 0.83 / 1.91
Lowest Max Drawdown: Barclay BTOP50: 9.7%
Most Winning Months: Classic Trend Index & Barclay BTOP50: 60.3%
Best YTD: Barclay BTOP50: −2.9%
Lowest 12-month loss: Classic Trend Index: −0.4% and BTOP50: −0.5%
August Reflections
August’s across-the-board green ink was a welcome shift. But the structural lessons remain unchanged:
-
Classic proves again that compounding comes not just from catching outliers, but from recovering faster when losses hit. This rapid rebound is what turns persistence into exponential growth.
-
BTOP50 shows why allocators lean on it as a stabilizer, with unmatched resilience.
-
Momentum-focused and broader blends continue to show sensitivity to trend scarcity and rotation-heavy regimes.
The allocator’s takeaway? A barbell approach…Classic as the compounding engine with fast recovery power, BTOP50 as the defensive anchor, captures the best of both persistence and resilience.
“August showed the power of structure over signal. When all boats rise, the true differences lie in how quickly they recover from the storms.”
About the Indexes
- SG Trend Index
Created by Société Générale, the SG Trend Index represents the largest trend-following CTA programs, focusing on systematic strategies with significant AUM. It captures broad market movements across various assets. More on SG Trend Index - Barclay BTOP50 Index
Managed by BarclayHedge, this index follows the largest investable CTAs, emphasizing diversification across major futures markets. It’s a widely referenced benchmark for managed futures. More on BTOP50 Index - TTU Trend Following Index
Developed by Top Traders Unplugged, the TTU TF Index includes programs with a 15-year track record, emphasizing resilience through experience and diversification across a large ensemble of programs. More on TTU TF Index - SG CTA Index
Another index by Société Générale, the SG CTA Index covers a broader array of CTA strategies, providing insight into the managed futures landscape beyond trend following alone. More on SG CTA Index - IASG Trend Following Index
This index, managed by IASG, tracks CTAs that primarily use trend-following strategies, offering a focused benchmark within the managed futures space. More on IASG TF Index - Classic Trend Index
The Classic Trend Index, curated by the Aussie Turtles, is a benchmark for traditional trend-following strategies, focusing on consistent, systematic approaches across diversified asset classes. More on Classic Trend Index - Systematic Momentum CTA Index
Managed by NilssonHedge, this index tracks CTAs focused on momentum-based strategies, providing a purist view of momentum trading within managed futures. More on Systematic Momentum CTA Index
Stay tuned for next month’s Battle of the Trend Following Indexes to see which benchmarks emerge as the top performers in the trend-following landscape.