Battle of the Trend Following Indexes: March 2025
In the Battle of the Trend Following Indexes, we present a monthly update on some of the most respected trend-following benchmarks.
March 2025 Result
March was a bruising continuation of February’s retreat, as whipsawing markets and vanishing trends battered trend-following models across the board. The great battlefields of systematic investing offered no refuge this month—volatility persisted, and directional conviction was absent.
Once again, the Classic Trend Index held the high ground despite taking a -2.5% hit in March. Even with the losses, its towering CAGR of 15.3% and MAR ratio of 1.75 keep it firmly entrenched as the benchmark for capturing outlier moves with disciplined trend adherence.
Performance Highlights
March continued the challenging stretch for trend followers, with six of the seven major indexes finishing in the red. Only the Barclay BTOP50 posted a gain, confirming its status as the most defensive and stable of the group. Meanwhile, the Classic Trend Index, despite a -2.5% decline, continues to dominate the long-term landscape, with a return profile that sets it well apart from the field.
Here’s how each index performed in March:
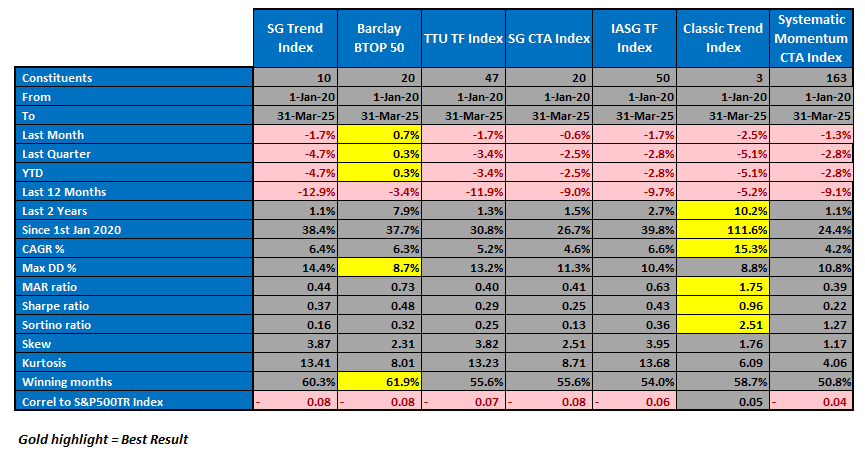
Classic Trend Index: Dropped -2.5% in March and -5.1% YTD, yet remains the undisputed long-term leader with a CAGR of 15.3%, Sharpe ratio of 0.96, Sortino of 2.51, and 111.6% total return since Jan 2020. Its drawdown remains moderate at 8.8%, further strengthening its exceptional MAR ratio of 1.75.
SG Trend Index: Fell -1.7% in March and is now down -4.7% YTD, with a 12-month return of -12.9%. Its CAGR of 6.4% is solid, but a 14.4% max drawdown continues to suppress its MAR ratio (0.44).
Barclay BTOP50: The only index to finish March positive at +0.7%, also leading YTD with +0.3%. Its drawdown is the lowest of all (8.7%), and it boasts the highest percentage of winning months (61.9%), reinforcing its reputation as the most conservative trend-following benchmark.
TTU Trend Following Index: Dropped -1.7% in March and is now -3.4% YTD, with a CAGR of 5.2% and Sharpe of 0.29. Its 13.2% max drawdown limits its risk-adjusted appeal, though its broad composition provides useful signal diversity.
SG CTA Index: Held up reasonably well, declining just -0.6% for the month and -2.5% YTD, with a CAGR of 4.6% and drawdown of 11.3%. A lower-volatility performer, but lacking upside over the long haul.
IASG TF Index: Also fell -1.7%, bringing YTD losses to -2.8%. Its CAGR of 6.6% and Sharpe of 0.43 reflect balanced, steady returns, albeit with a moderate 10.4% drawdown.
Systematic Momentum CTA Index: Declined -1.3%, continuing a tough stretch with -2.8% YTD and -9.1% over 12 months. With a CAGR of 4.2% and relatively modest risk metrics, it remains a key proxy for pure momentum systems, but has struggled recently to keep pace.
Performance Snapshot
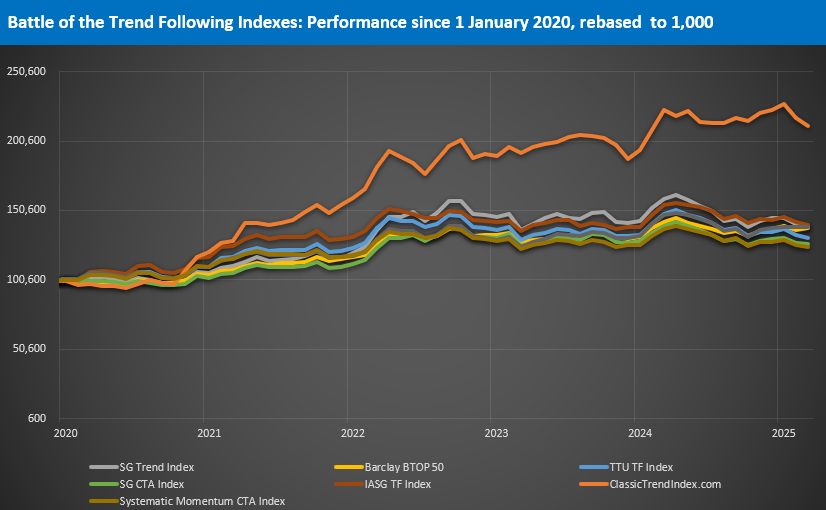
The VAMI chart still tells a compelling story of Classic Trend Index dominance, now boasting a total return of 111.6% since January 2020—comfortably ahead of the pack. While March added to February’s stumble, the Classic Trend Index remains the clear trend titan, standing tall above its more defensive and clustered peers.
Statistical Table
March’s results highlight a key feature of the current trend-following landscape: most indexes remain tightly clustered, showing little dispersion in long-term performance or risk metrics. Their similar trajectories reflect a common struggle with recent market indecision.
But one index continues to stand apart—the Classic Trend Index. With a CAGR above 15%, a Sharpe ratio over 1, and a Sortino exceeding 2.5, its performance clearly diverges from the pack. This dispersion is clearly reflected in the VAMI chart above, where Classic Trend separates from the cluster and continues its long climb. In an environment where most strategies move in lockstep, Classic Trend proves that true differentiation still exists.
March Reflections
March extended the headwinds for trend followers, reinforcing the lesson from February: when markets lack directional persistence, trend strategies suffer. The month brought more chop than conviction, testing the adaptability and patience of systematic models.
Yet through the fog, one signal remains clear — the Classic Trend Index continues to exemplify the strength of traditional, process-driven approaches. While not immune to drawdowns, its long-term outperformance stands as a testament to consistency, diversification, and staying the course through uncertainty.
“Classic Trend continues to prove that not all trend-following is created equal.”
About the Indexes
- SG Trend Index
Created by Société Générale, the SG Trend Index represents the largest trend-following CTA programs, focusing on systematic strategies with significant AUM. It captures broad market movements across various assets. More on SG Trend Index - Barclay BTOP50 Index
Managed by BarclayHedge, this index follows the largest investable CTAs, emphasizing diversification across major futures markets. It’s a widely referenced benchmark for managed futures. More on BTOP50 Index - TTU Trend Following Index
Developed by Top Traders Unplugged, the TTU TF Index includes programs with a 15-year track record, emphasizing resilience through experience and diversification across a large ensemble of programs. More on TTU TF Index - SG CTA Index
Another index by Société Générale, the SG CTA Index covers a broader array of CTA strategies, providing insight into the managed futures landscape beyond trend following alone. More on SG CTA Index - IASG Trend Following Index
This index, managed by IASG, tracks CTAs that primarily use trend-following strategies, offering a focused benchmark within the managed futures space. More on IASG TF Index - Classic Trend Index
The Classic Trend Index, curated by the Aussie Turtles, is a benchmark for traditional trend-following strategies, focusing on consistent, systematic approaches across diversified asset classes. More on Classic Trend Index - Systematic Momentum CTA Index
Managed by NilssonHedge, this index tracks CTAs focused on momentum-based strategies, providing a purist view of momentum trading within managed futures. More on Systematic Momentum CTA Index
Stay tuned for next month’s Battle of the Trend Following Indexes to see which benchmarks emerge as the top performers in the trend-following landscape.