Battle of the Trend Following Indexes: July 2026
The Battle of the Trend Following Indexes is our monthly comparison of the leading trend-following benchmarks. All figures are through 31 July 2026, with each index history rebased to 1,000 on 1 January 2020.

July 2026 Result
July gave us the same result as June, but for almost the opposite reason. All seven indexes finished negative for a second straight month. In June, the TTU Trend Barometer surged from 32 to 55 while every index lost money. In July, it fell from 55 to 30, ending in Very Weak territory, and every index lost money again. A 23-point rise in one month and a 25-point fall in the next. Same sign on the ledger. Very different market underneath it.
The difference was in the size and ordering of the losses. BTOP50 declined least at -0.6%, followed by Systematic Momentum at -0.9%, SG Trend at -1.1%, SG CTA at -1.3%, TTU at -1.6%, Classic Trend at -2.2% and IASG at -2.6%. The gap from best to worst narrowed to 2.0 percentage points from 2.8 in June. More importantly, the ranking stopped following the construction spectrum. June’s losses had lined up almost perfectly with concentration. July scrambled the order: a 50-constituent benchmark finished last, a 20-constituent benchmark first, and the most concentrated index sat between them.
That is probably July’s most useful observation. It does not invalidate the framework. It tells us when the framework has something to work with. Convexity is conditional, not permanent. A concentrated construction carries the clearest trends in greater size, which magnifies the payoff when those trends persist and the damage when they break. But first there has to be a meaningful trend to hold. When the market offers no dominant move with persistence, the structural differences between these indexes have far less opportunity to express themselves. Dispersion compresses and ranking becomes noisier.
July never produced that dominant move. Leadership changed hands every week, usually by reversing what had just worked. Orange Juice jumped 20.32% in the first week and fell 16.72% in the second. Cocoa surged 20.43% in week two and dropped 8.77% in week three. Energy led through the third and fourth weeks, then fell 3.10% in the fifth as crude surrendered most of a two-week breakout. All eight grain contracts rose in the second week. All eight fell in the fifth. July was not short of movement. It was short of movement that survived.
The final two weeks make the point neatly. Breadth was 23 of 49 markets higher in the week to 24 July and 24 of 49 in the week to 31 July. One contract separated the readings. Yet across those same two weeks the SG Trend Index returned roughly +2.2% and then -2.7%. Neither breadth nor the barometer could explain that difference on its own. The decisive question was whether the moves on the board extended positions already held or turned against them.
The year-to-date race tightened at the top and opened further at the bottom. SG CTA leads at 8.0%, with SG Trend and BTOP50 both at 7.9%. One tenth of a percentage point separates first from third. TTU follows at 6.6%, Systematic Momentum at 5.0%, IASG at 2.9% and Classic Trend at 2.6%. All seven are negative over the trailing quarter. Classic Trend moved from the best number in that column to the second-worst in a single month, from +4.0% to -4.8%, not because the index suddenly changed character, but because April’s +6.7% rolled out of the three-month window. A useful reminder that rolling statistics have memory, and sometimes what disappears matters as much as what arrives.
The long-run hierarchy barely moved. Classic Trend continues to lead total return, CAGR, MAR, Sharpe and Sortino since 1 January 2020. BTOP50 still owns the shallowest maximum drawdown at 9.7% and the highest share of winning months at 62.0%. Classic Trend’s maximum drawdown remains 15.8% for a second consecutive month. Two losing months have hurt, but they have not pushed the index beyond its previous worst historical decline.
Performance Highlights
Here is how the seven indexes came through July:
Barclay BTOP50 Index
July: -0.6%, the smallest decline in the group and a return to the defensive end of the table after an unusually weak relative result in June. Trailing quarter: -1.8%, best of the seven. YTD: +7.9%, level with SG Trend and just 0.1 percentage point behind the leader. Since 2020, BTOP50 has gained 52.7% at a 6.6% CAGR, with the group’s lowest maximum drawdown at 9.7% and highest share of winning months at 62.0%. Its Last 2 Years return of 11.1% is also the strongest in the comparison. June has been revised from -1.8% to approximately -1.1%.
Systematic Momentum CTA Index
July: -0.9%, the second-smallest loss and a clear improvement on June’s bottom-half placement. Trailing quarter: -2.5%. YTD: +5.0%, fifth in the group. Since 2020, the index has gained 35.0% at a 4.7% CAGR with a 16.7% maximum drawdown. Its 163 constituents give it by far the broadest sampling of the systematic momentum universe. In a month without a dominant trend to carry in size, that breadth cost very little. Its Sortino ratio of 0.92 remains second-highest among the seven.
SG Trend Index
July: -1.1%. Trailing quarter: -2.0%. YTD: +7.9%, only 0.1 percentage point from the lead. Its Last 12 Months return of +22.8% remains the best in the group for a second straight month. Since 2020, SG Trend is up 60.7% at a 7.5% CAGR with a 20.4% maximum drawdown. The intra-month path tells July’s story better than the final number: -0.74% after week one, -0.46% after week two, -0.95% after week three, +1.24% after week four and -1.50% at the end of week five. The month crossed the flat line four times.
SG CTA Index
July: -1.3%. Trailing quarter: -2.0%. YTD: +8.0%, preserving the lead SG CTA has held for three months, although now by only 0.1 percentage point. Since 2020, the index has gained 40.2% at a 5.3% CAGR with a 16.3% maximum drawdown. Its Last 12 Months return of 16.6% and Sharpe of 0.30 remain toward the lower end of the group, consistent with a construction that spreads exposure across a broader systematic factor set. That dilution has been helpful through the past three months, although its Sortino of 0.12 remains the lowest of the seven.
TTU Trend Following Index
July: -1.6%. Trailing quarter: -3.3%, fifth in both tables. YTD: +6.6%, fourth. Since 2020, TTU has gained 46.3% at a 5.9% CAGR with a 20.7% maximum drawdown, still the deepest in the comparison. Its Last 12 Months return of 21.3% is second only to SG Trend. The 47-program ensemble produced a below-median loss in a month when diversification across managers offered less shelter than usual. The reversals arrived sequentially rather than all at once, reaching different constituents at different times.
Classic Trend Index
July: -2.2%, the second-largest loss, but only 0.6 percentage point behind TTU immediately above it. That gap is far narrower than June’s. Trailing quarter: -4.8%, second-lowest after April’s +6.7% rolled out of the window. YTD: +2.6%, now last in the group. Since January 2020, Classic Trend has gained 134.6% at a 13.8% CAGR, roughly twice the next-highest total return. It also retains the strongest MAR at 0.88, Sharpe at 0.80 and Sortino at 1.36. Maximum drawdown remains unchanged at 15.8% for a second month.
IASG Trend Following Index
July: -2.6%, the largest decline in the group. Trailing quarter: -4.9%, also the weakest. YTD: +2.9%. IASG’s history has been restated this month, so its long-run figures are not continuous with those published in June. On the revised series, the index has gained 57.1% since 2020 at a 7.1% CAGR, both second only to Classic Trend, while its 15.7% maximum drawdown is the second-lowest in the comparison by 0.1 percentage point. Its MAR of 0.45 and Sharpe of 0.45 remain the strongest peer-relative readings outside Classic Trend.
Performance Snapshot
The table below compares the seven trend-following indexes through 31 July 2026. Gold-highlighted cells mark the strongest result in each row.
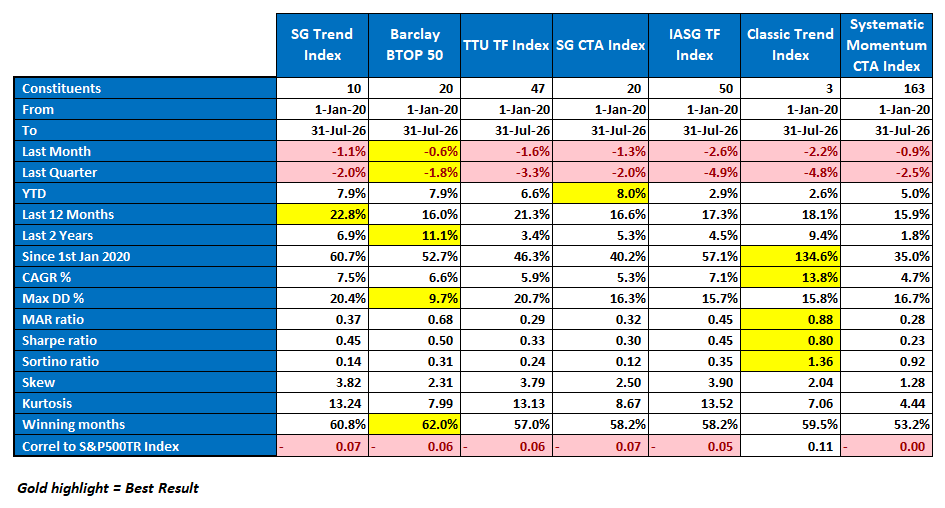
Comparative performance statistics for the seven trend-following indexes through 31 July 2026.
A note on comparability. The IASG Trend Following Index history has been restated since the June edition. Its since-2020 return moves from 69.1% to 57.1%, CAGR from 8.4% to 7.1%, and maximum drawdown from 13.2% to 15.7%. The revision is much larger than July’s return could explain and resolves the inconsistency noted last month, when the reported drawdown appeared to shrink. For comparisons with earlier editions, the IASG long-run column should therefore be treated as a new series. BTOP50, which reports on an estimated basis, has also revised June from -1.8% to approximately -1.1%. The other five indexes reconcile across both the year-to-date and since-2020 columns.
Performance Since 1 January 2020
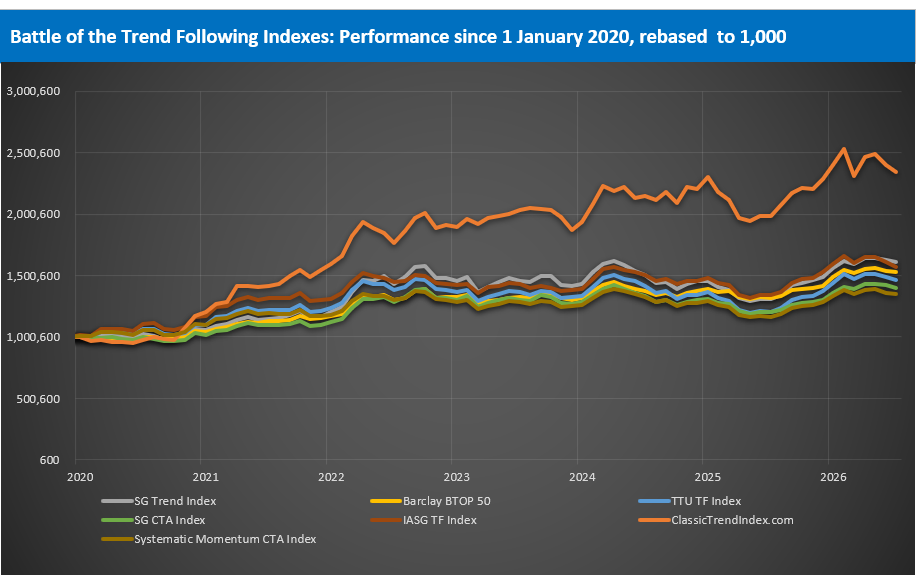
The chart below plots the value-added monthly index (VAMI) for all seven benchmarks, rebased to 1,000 on 1 January 2020. Classic Trend remains well clear of the peer group over the full period. The second consecutive monthly decline is visible at the right-hand edge, while the other six indexes remain comparatively tightly clustered beneath it.
Performance Commentary
Barclay BTOP50 Index
BTOP50 returned -0.6% in July, the smallest loss in the comparison, reversing its weaker relative placement in June. This is the sort of month in which a diversified, volatility-targeted construction can look most defensive. There was no single dominant trend for the portfolio to be caught heavily on the wrong side of. Instead, July delivered five weeks of rotation. The feature that offered little protection in June, when equities, precious metals and crypto turned together, helped in July because almost nothing moved together for long. BTOP50’s 9.7% maximum drawdown remains comfortably the lowest in the group, its 62.0% winning-month rate the highest, and its Last 2 Years return of 11.1% now leads outright.
Systematic Momentum CTA Index
Systematic Momentum returned -0.9% in July and stands at +5.0% YTD. Its 163-constituent breadth did little to help in June because the industry’s losses were unusually common. July was different. The errors were scattered across sectors and across time. Diversification can dilute idiosyncratic error; it cannot dilute a common one. That distinction explains why the same broad benchmark can sit in the bottom half one month and near the top the next without anything fundamental changing in its construction. Its Sortino ratio of 0.92 remains second-highest in the group, a stronger showing than the 4.7% CAGR alone might suggest.
SG Trend Index
SG Trend returned -1.1% in July, sits at +7.9% YTD and retains the twelve-month lead at +22.8%. Its intra-month reporting gives us the clearest view of what July actually felt like. The index was -0.74% after week one as the risk rebound cut against prior short positioning, improved to -0.46% in week two as coffee, heating oil and grains ran, slipped back to -0.95% in week three as cocoa and coffee reversed, then surged to +1.24% in week four as crude extended a breakout already two weeks old. By month-end that breakout had failed and the index stood at -1.50% on the daily estimate, before the final published figure settled at -1.1%. Four changes of sign in five weeks. The path tells us far more than the final one-point loss.
SG CTA Index
SG CTA returned -1.3% in July and remains the YTD leader at +8.0%, its third straight month at the top, although SG Trend and BTOP50 are now only 0.1 percentage point behind. Its Last 12 Months return of 16.6% and Sortino of 0.12 sit at the bottom of the comparison. That is the continuing trade-off in a benchmark that spreads exposure beyond pure trend into a broader systematic universe. Over the past three months, while the trend factor itself has struggled, that dilution has helped. SG CTA has led this losing stretch by participating less, not by capturing more. When persistent trends return, the same structural choice can work the other way.
TTU Trend Following Index
TTU returned -1.6% in July and stands at +6.6% YTD. Its Last 12 Months return of +21.3% remains second only to SG Trend. Maximum drawdown is 20.7%, the deepest in the group, while its Sharpe of 0.33 sits near the lower end. June demonstrated the limit of manager diversification when a common market event hits many books together. July exposed a different weakness. Reversals arrived one sector at a time, reaching different managers at different moments. An ensemble can smooth a rolling sequence of small errors, but if the errors keep coming, averaging changes the path more readily than the destination.
Classic Trend Index
Classic Trend fell -2.2% in July, the second-largest loss, and ends the month at +2.6% YTD, last in the group. But the gap matters more than the rank. In June, Classic Trend lost more than twice as much as the next-worst index. In July, it finished only 0.6 percentage point behind TTU and 1.6 behind BTOP50. Concentration amplifies what the market gives it, and July gave it very little worth amplifying. The trailing-quarter figure of -4.8% has swung from best in the group to second-worst because April’s +6.7% dropped out of the window. Since 1 January 2020, Classic Trend is still up 134.6%, roughly double the next-highest total return. Its MAR of 0.88, Sharpe of 0.80 and Sortino of 1.36 remain the strongest in the comparison, while maximum drawdown is unchanged at 15.8%. Its +0.11 correlation to the S&P 500 Total Return remains the only positive reading in the group.
IASG Trend Following Index
IASG returned -2.6% in July, the largest loss in the comparison, and stands at +2.9% YTD. Because its historical series has been restated since the June edition, the long-run column should be read as a new series rather than a seamless continuation. What the revision does not change is IASG’s structural position within the group. Across 50 constituents it still combines the second-highest long-run return with the second-lowest maximum drawdown. Its MAR of 0.45 and Sharpe of 0.45 remain the strongest peer-relative readings outside Classic Trend. The restatement changes the level. It does not materially change the hierarchy.
July Market Narrative
July was a month of rotation without persistence. The TTU Trend Barometer moved 64, 39, 50, 52 and 30 across the five weeks, opening at its highest reading since April and finishing at its lowest of the sequence. Peak to trough, that is a 34-point swing inside one month. Contract-level breadth told a much calmer story after week one: 29, 31, 23, 23 and 24 of 49 markets higher. The two measures repeatedly diverged because they measure different things. Breadth asks how many markets rose. The barometer asks how many are moving with enough force and persistence to qualify as trends. In July, large moves kept becoming reversals. Breadth barely moved while trend strength lurched around it.
Week ending 3 July: Risk appetite returns and the barometer runs to 64
July opened by undoing the final week of June. Metals gained 2.46% with all five contracts higher, led by Silver at +5.26%. Equity Indices resumed their advance at +1.92%, with the DAX up 4.46%. Soft Commodities topped the board at +5.20%, driven by a 20.32% surge in Orange Juice, while Cocoa moved the other way at -4.02%. Bitcoin bounced 4.84% and the VIX fell 8.18%. Breadth flipped to 29 of 49 markets higher. The barometer climbed 9 points to 64, its highest reading of the month and a Very Strong classification. Yet SG Trend opened July at -0.74%. Cocoa, Rough Rice and both cattle contracts reversed their prior-week moves, while refined products ran sharply against any short energy exposure. A strong environment reading did not mean the existing book was positioned to collect it.
Week ending 10 July: Commodities take the lead and the barometer falls 25 points
Week two shifted leadership squarely into commodities and produced the sharpest one-week fall in the barometer this year. Grains led at +5.25%, all eight contracts higher, with Wheat up 6.75%. Energy gained 2.93% as Heating Oil jumped 11.66% and the crude complex turned higher. Soft Commodities remained near the top at +3.73% on Cocoa’s 20.43% surge, while Orange Juice reversed violently, falling 16.72% after the previous week’s spike. Breadth actually improved to 31 of 49 markets higher, the best count of the month, yet the barometer collapsed 25 points to 39 and Moderately Weak. The explanation is simple: many of the higher closes were reversals, not continuations. They were moves, but they were not yet trends. SG Trend edged up to -0.46%.
Week ending 17 July: The petroleum complex surges
The third week produced July’s most coherent sector move. Energy surged 9.55%, with all four petroleum contracts gaining between 13.67% and 15.91% as crude finally broke higher from the range it had been pressing against for weeks. At the same time, the previous week’s winners rolled over. Soft Commodities fell 3.39% as Cocoa lost 8.77% and Coffee 4.17%. Equity Indices declined 2.16% with all seven contracts lower, while Metals fell 2.36% as Silver gave back 6.38%. Breadth slipped to 23 of 49 markets higher, but the barometer recovered 11 points to 50. The energy move was large, uniform and increasingly directional. SG Trend nevertheless slipped to -0.95%. The move had to be caught before it could be carried.
Week ending 24 July: Established trends hold and the index recovers
Week four was the exception. For once, the moves already in the book kept going. Energy led again at +3.51%, with Brent adding 9.85% and WTI 9.21% on top of the previous week’s double-digit gains. Bonds declined 0.81% across the curve in the same gradient they had been tracing for weeks. The dollar strengthened against six of seven crosses, and four grain contracts advanced together. Breadth was unchanged at 23 of 49 markets higher and the barometer added only 2 points to 52. Yet SG Trend jumped from -0.95% to +1.24% for the month, a weekly gain of roughly 2.2%. The environment readings barely changed. What changed was persistence. Crude was now two weeks into its breakout, so portfolios already positioned could be carried by the move rather than forced to chase it.
Week ending 31 July: Crude surrenders the breakout
The final week inverted the fourth almost perfectly. Energy fell 3.10% as Brent gave back 7.08% and WTI 5.20% of the gains accumulated over the previous fortnight. Grains fell across all eight contracts, down 5.42% as a sector, the largest sector move of the week. The dollar reversed as well, with the USD Index down 1.49% and all seven other crosses higher. Gains appeared in markets that had already fallen a long way, including Orange Juice at +9.31% and Coffee at +5.83%. Breadth was 24 of 49 markets higher, only one contract different from the week before. The barometer, however, collapsed 22 points to 30 and Very Weak. SG Trend fell from +1.24% to -1.50%, a weekly loss of roughly 2.7%. Almost everything that had paid in week four turned against the book in week five.
Implications for Index Construction and July Capture
June’s losses came from transition. The trends that had driven the year broke, while the new downside moves were still too young to be carried meaningfully. The constructions holding the old trends in the greatest size paid the largest price. July was messier. There was no clean transition because nothing survived long enough to become established. Energy came closest, running for two weeks before surrendering much of the move. July cost money not because one dominant trend was held the wrong way, but because a succession of plausible new trends kept dying before they matured.
That changes how the monthly ranking should be read. The dispersion we are trying to observe comes from differences in index construction, and those differences need a persistent market move before they can fully reveal themselves. Remove persistence and the seven benchmarks naturally converge. A 2.0 percentage-point spread across indexes containing anywhere from 3 to 163 constituents is telling us exactly that. In such a month, BTOP50 at -0.6% and IASG at -2.6% say less about the enduring merits of a diversified volatility-targeted book versus a 50-manager trend ensemble, and more about which parts of July each happened to be positioned for.
There is a second lesson in the environment readings. Across June and July the barometer first rose 23 points, then fell 25, yet every one of the seven indexes lost money in both months. The barometer describes the trend environment that exists now. Trend-following returns depend on positions established earlier and on whether today’s market continues to reward them. Those ideas are connected, but they are not synchronous. July showed just how far apart they can become, and how quickly the relationship can reverse.
Closing Reflection
July delivered a second consecutive losing month for all seven indexes, the narrowest monthly dispersion of the year at 2.0 percentage points, and the weakest month-end trend reading in the sequence. BTOP50 lost least at -0.6% and now leads the two-year table at +11.1%. SG CTA holds the YTD lead at +8.0%, only 0.1 percentage point ahead of SG Trend and BTOP50. SG Trend retains the twelve-month lead at +22.8%. Classic Trend fell -2.2%, sits last YTD at +2.6%, yet continues to lead the long-horizon return and return-to-volatility statistics shown here, with maximum drawdown unchanged across both losing months.
June reminded us that opportunity appearing and opportunity being captured are two different things. July’s lesson is more specific. The characteristics that separate these indexes are not switched on all the time. Concentration, breadth, volatility targeting and factor dilution are mechanisms for translating market movement into portfolio outcomes. They need the right kind of movement before their differences become visible. Five weeks in which every promising leader reversed within a fortnight gave those mechanisms very little room to operate. Seven indexes built in markedly different ways finished within two percentage points of one another.
That is worth keeping in mind the next time the same table shows a four or five point gap. Dispersion is not solely a property of the managers or the index rules. It is also a property of the market environment they are being asked to navigate. July did not suddenly make these indexes more alike. It simply failed to ask the question on which their differences matter most: what happens when a trend persists long enough to be held?
About the Indexes
- SG Trend Index
Created by Société Générale, the SG Trend Index represents the largest trend-following CTA programs, focusing on systematic strategies with significant AUM. It captures broad market movements across various assets. More on SG Trend Index - Barclay BTOP50 Index
Managed by BarclayHedge, this index follows the largest investable CTAs, emphasizing diversification across major futures markets. It’s a widely referenced benchmark for managed futures. More on BTOP50 Index - TTU Trend Following Index
Developed by Top Traders Unplugged, the TTU TF Index includes programs with a 15-year track record, emphasizing resilience through experience and diversification across a large ensemble of programs. More on TTU TF Index - SG CTA Index
Another index by Société Générale, the SG CTA Index covers a broader array of CTA strategies, providing insight into the managed futures landscape beyond trend following alone. More on SG CTA Index - IASG Trend Following Index
This index, managed by IASG, tracks CTAs that primarily use trend-following strategies, offering a focused benchmark within the managed futures space. More on IASG TF Index - Classic Trend Index
The Classic Trend Index, curated by the Aussie Turtles, is a benchmark for traditional trend-following strategies, focusing on consistent, systematic approaches across diversified asset classes. More on Classic Trend Index - Systematic Momentum CTA Index
Managed by NilssonHedge, this index tracks CTAs focused on momentum-based strategies, providing a purist view of momentum trading within managed futures. More on Systematic Momentum CTA Index
Stay tuned for next month’s Battle of the Trend Following Indexes to see which benchmarks emerge as the top performers in the trend-following landscape.
Get the Aussie Turtles® Trend Following Guide
If you want to go deeper into the principles behind trend following and build a process that survives real market conditions, the Aussie Turtles® Trend Following Guide is now available on Amazon.
This book is a field manual for traders who want to move beyond prediction and commit to disciplined, systematic practice. Written by Adam Havryliv and Richard Brennan, it distills decades of experience into a practical and philosophical framework for navigating complex markets.
The guide challenges the myths of consistency and control. It explains why markets evolve through trader impact, serial correlation, and emergent structure rather than forecasts. It does not promise a holy grail system. Instead, it teaches the mindset required to capture the rare asymmetric outliers that drive long term performance.
If you are ready to trade with clarity, resilience, and conviction, this is the place to start. Click on the image below.