Battle of the Trend Following Indexes: June 2026
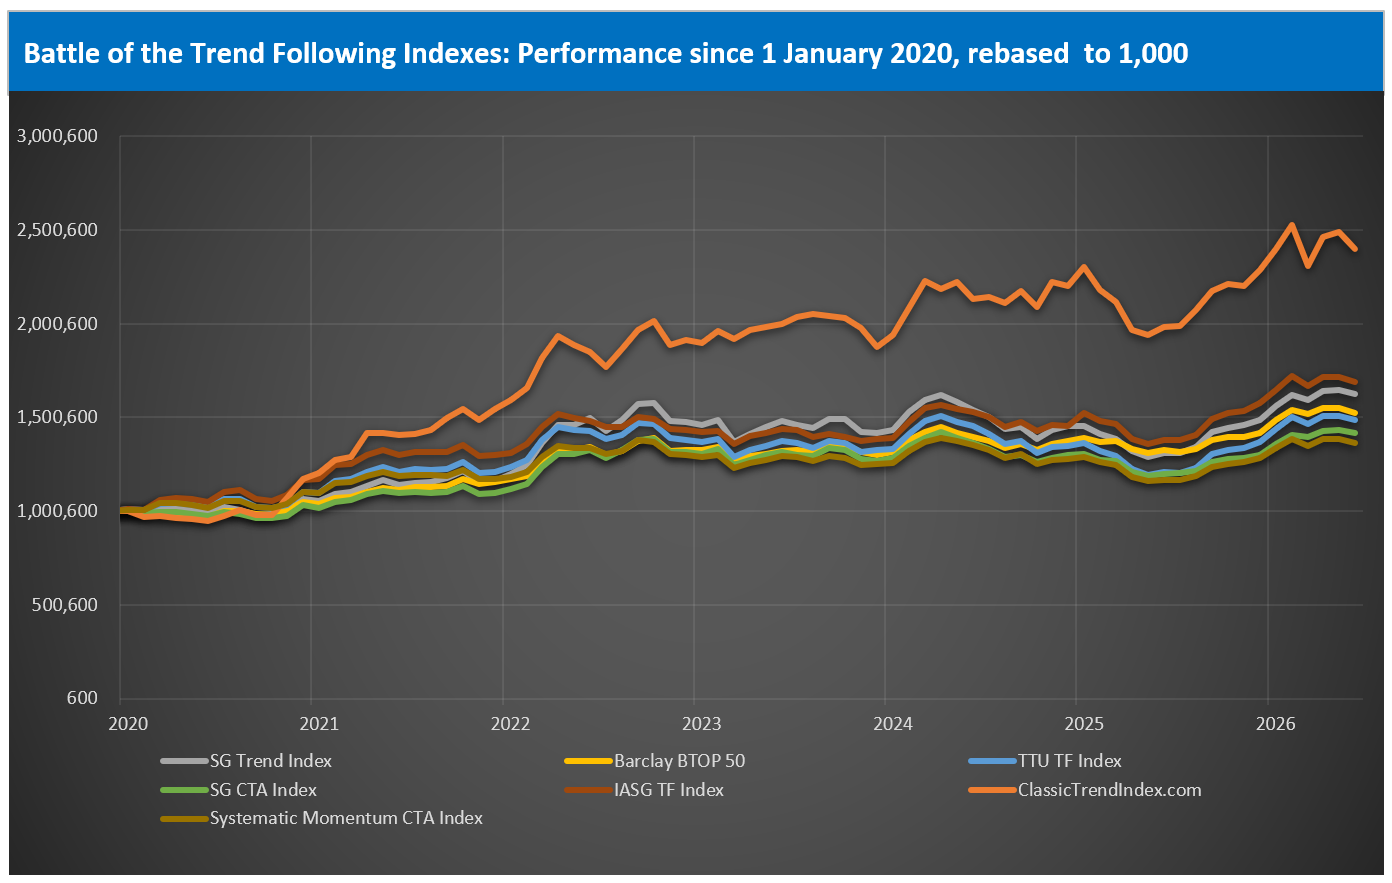
The Battle of the Trend Following Indexes provides a monthly snapshot of the leading trend-following benchmarks. All figures reflect performance through 30 June 2026, with index histories rebased to 1,000 on 1 January 2020.

June 2026 Result
June inverted May’s result without inverting its logic. All seven indexes finished the month negative, where in May all seven finished positive, and the month delivered the widest downside dispersion of the year. The complication is that it happened while the trend environment was improving. The TTU Trend Barometer traced 43, 43, 45, 55 across the four weeks, closing at the threshold where Neutral gives way to a favourable environment after ending May at 32. Conditions for trend following got better through June, and trend followers lost money.
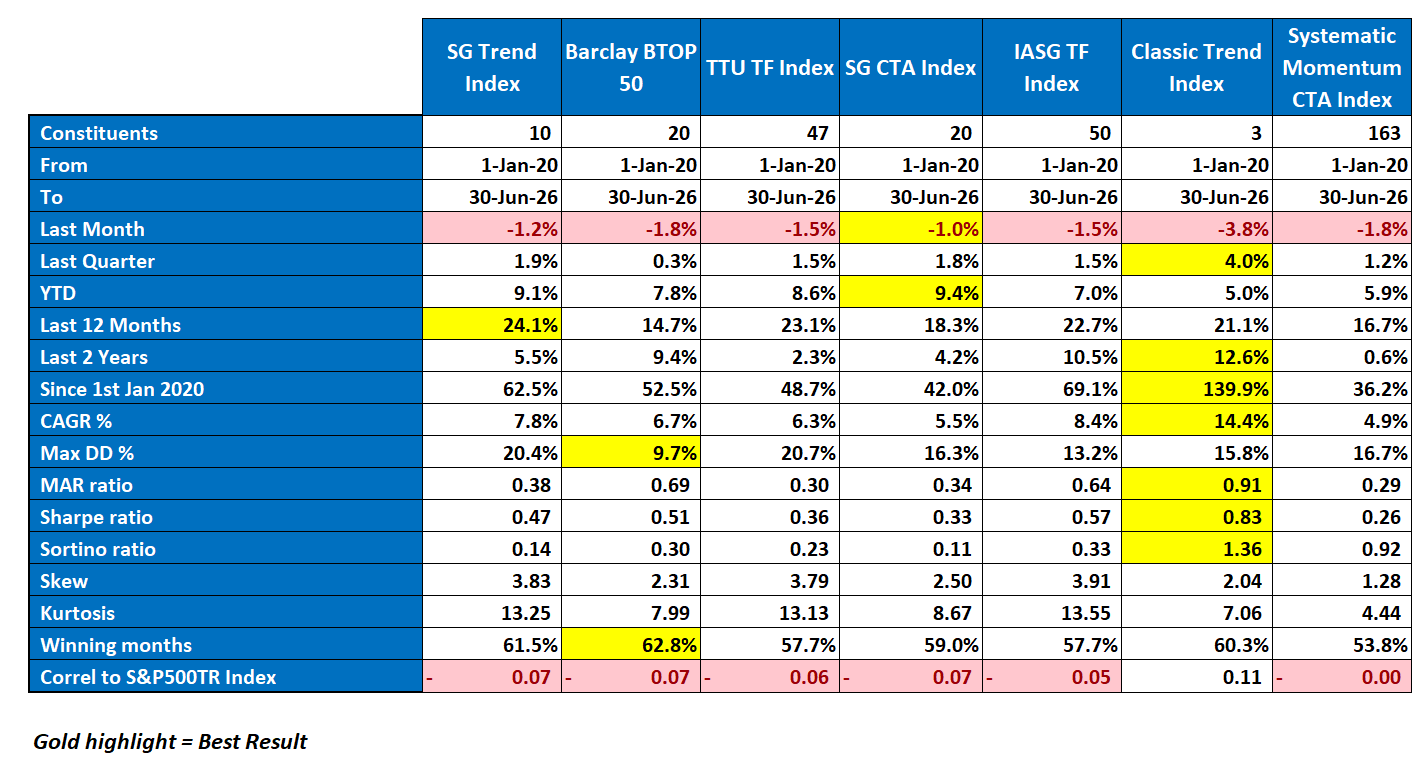
Classic Trend posted the largest decline at -3.8%, more than double the next-worst. BTOP50 and Systematic Momentum each fell 1.8%, TTU and IASG each 1.5%, SG Trend 1.2%, and SG CTA held the smallest loss at 1.0%. The spread from best to worst was 2.8 percentage points, against roughly one in May.
The two facts reconcile once the barometer is read for what it measures. It counts the share of markets generating medium-to-strong trends in either direction, and says nothing about whether those trends are the ones a portfolio already holds. Almost all of June’s new trend strength was built on the downside: the petroleum complex extended a breakdown into a third week, the precious metals turned a shallow pullback into a sustained decline, the equity indices rolled over from records, and Bitcoin pressed lower. Each move added to the count of trending markets. Each ran against positioning the year’s advance had built.
A new trend is rarely born into an empty market. It is born from the failure of the one before it. The barometer registers the new trend the moment it forms, while the book is still carrying its predecessor, so the climb from 32 to 55 was less a signal of returns to come than a tally of the reversals that were costing them.
The year-to-date standings compressed rather than reordered. SG CTA continues to lead on 9.4%, SG Trend sits close behind and TTU only marginally lower, while Classic Trend has fallen to the bottom of that table at 5.0% after entering the month mid-field. The real story is not the leadership but how tightly the field closed up behind it. The trailing-quarter table runs the other way, with Classic Trend on top, because April’s +6.7% still dominates a window that now also contains June’s worst result. Over twelve months the lead has changed hands, SG Trend displacing Classic Trend at 24.1%.
The long-run table is a different matter. Classic Trend still leads CAGR, MAR, Sharpe, Sortino and total return since 1 January 2020, while BTOP50 keeps the lowest drawdown and the highest win rate. Nothing at the top of that table moved. Everything on it got a little smaller.
Classic Trend’s larger decline is simply the downside of its greater convexity, the same characteristic that allows it to outperform strongly when trends persist. It produced +6.7% in April and +1.2% in May, and the quarter has now shown all three states of that design in sequence: amplification, dormancy and drawdown. A concentrated construction carries the market’s clearest trends in larger size than a diversified one. That is an advantage while the trends persist and a cost in the week they turn. June was that week, repeated four times. Where an allocator sits on the spectrum remains a matter for their own judgement.
Performance Highlights
Here is how the indexes performed in June:
Classic Trend Index
-3.8% for June, the largest monthly decline among the seven benchmarks and more than double the next-worst result. Trailing quarter +4.0%, the best of the seven, with April’s gain still dominating the window. YTD +5.0%, now the lowest of the group. Since January 2020 the index has gained 139.9% with a 14.4% CAGR, and it retains leadership across the long-term risk-adjusted measures, with a MAR of 0.91, a Sharpe of 0.83 and a Sortino of 1.36, each below the May reading. The maximum drawdown of 15.8% is unchanged and third-lowest. The Last 12 Months return of 21.1% is fourth, on a horizon the index led a month ago.
Barclay BTOP50 Index
-1.8% for June, level with the weaker half of the group rather than ahead of it, an unusual placement for the most defensive construction in the comparison. Trailing quarter +0.3%, the lowest of the seven. YTD +7.8%. Since 2020 the index has gained 52.5% with a 6.7% CAGR, the lowest drawdown of the group at 9.7% and the highest proportion of winning months at 62.8%. The diversified, volatility-targeted profile that held positive ground through May’s fractured tape offered less protection in June, when the reversals arrived across equities, precious metals and crypto at once rather than splitting sector by sector.
SG Trend Index
-1.2% for June and +1.9% for the trailing quarter, the best of the seven. YTD +9.1%, second in the year-to-date table, and the Last 12 Months return of +24.1% is the highest in the comparison, a position taken from Classic Trend this month. Since 2020 the index is up 62.5% with a 7.8% CAGR and a 20.4% drawdown. The intra-month path is worth recording: +1.35% MTD after the first week, a give-back of 2.27 percentage points in the second, then 0.10 lower in the third and a further 0.50 in the fourth. The damage was concentrated in a single reversal week rather than spread across the month.
SG CTA Index
-1.0% for June, the smallest decline in the comparison, and +1.8% for the trailing quarter. YTD +9.4%, holding the lead it took in May. Since 2020 the index is up 42.0% with a 5.5% CAGR and a 16.3% drawdown, and the Last 12 Months reading of 18.3% sits below the trend-focused peers, the usual consequence of a broader systematic construction. That same breadth is what limited the June loss: with the trend signal diluted across a wider factor set, the index carried less of the long equity and long metals exposure the month reversed.
TTU Trend Following Index
-1.5% for June and +1.5% for the trailing quarter. YTD +8.6%, third in the year-to-date table. Since 2020 the index has gained 48.7% with a 6.3% CAGR and a 20.7% drawdown, still the highest in the comparison, while the Last 12 Months return of 23.1% is second only to SG Trend. The 47-program ensemble produced a middle-of-the-pack loss, the expected outcome of averaging a wide manager set through a month of broad reversals. Breadth cannot avoid a turn that hits equities, metals and crypto at once, though it does limit how much any single positioning decision contributes.
IASG Trend Following Index
-1.5% for June and +1.5% for the trailing quarter. YTD +7.0%, the second-lowest of the seven. Since 2020 the index has gained 69.1% with an 8.4% CAGR, second only to Classic Trend, and its maximum drawdown of 13.2% is now the second-lowest in the group by a clear margin. The MAR of 0.64 and Sharpe of 0.57 remain the best peer-relative readings outside Classic Trend. Across 50 constituents, IASG continues to pair the second-highest long-run return in the comparison with the second-lowest drawdown.
Systematic Momentum CTA Index
-1.8% for June and +1.2% for the trailing quarter. YTD +5.9%, second-lowest of the seven. Since 2020 the index has gained 36.2% with a 4.9% CAGR and a 16.7% drawdown. The 163-constituent benchmark delivered a loss in line with the weaker half of the group despite carrying by far the widest sampling of the momentum universe, the clearest indication available that June’s reversals were general rather than manager-specific. Its Sortino ratio of 0.92 remains the second-highest in the comparison.
Performance Snapshot
The table below presents the comparative statistics for the seven trend-following indexes through 30 June 2026. Gold-highlighted cells indicate the best result in each row.
Performance Since 1 January 2020
The chart below shows the value-added monthly index (VAMI) for each of the seven indexes, rebased to 1,000 on 1 January 2020. The Classic Trend Index remains substantially ahead of the peer group on a since-inception basis, with June’s decline visible at the right-hand edge of the series.
Performance Commentary
Classic Trend Index
Classic Trend fell 3.8% in June, the largest single-month decline across the seven indexes and more than double the -1.8% recorded by BTOP50 and Systematic Momentum. The index closes June at 5.0% year to date, the lowest of the group, having entered the month mid-table. The Last Quarter return of +4.0% is nonetheless the best in the comparison, a reminder that the same three-month window contains April’s +6.7%. Over twelve months it has given up the lead it took in May, sitting fourth, while the Last 2 Years return of 12.6% remains the highest of the seven. Since 1 January 2020 the index has returned 139.9%, roughly double the next-highest in the comparison, and the MAR of 0.91, Sharpe of 0.83 and Sortino of 1.36 remain best-in-class at lower levels than a month ago. The maximum drawdown of 15.8% is unchanged, which is the more useful detail: the month’s loss did not extend the index’s worst historical decline. One marginal observation sits in the correlation row, where Classic Trend’s +0.11 to the S&P 500 Total Return is the only positive reading in the group. In a month when the equity uptrend paused and the metals turned, the index closest to the risk tape gave back the most.
Barclay BTOP50 Index
The Barclay BTOP50 returned -1.8% in June, a result sitting with the weaker half of the group rather than at the defensive end where it usually settles. The year-to-date reading is 7.8% and the Last 2 Years return of 9.4% is second only to Classic Trend, though the Last Quarter reading of 0.3% is the lowest in the comparison. The maximum drawdown of 9.7% remains the best by a wide margin and the winning-months figure of 62.8% the highest, so the structural case is intact. What June tested was a different property. A volatility-targeted, diversified construction protects best when losses concentrate in one or two complexes and the remainder of the book offsets them. June supplied no such offset: equities, precious metals and crypto turned together, and the energy short that paid was the same trade every construction in the comparison was already carrying.
SG Trend Index
The SG Trend Index returned -1.2% in June and sits at 9.1% year to date, second behind SG CTA. The Last 12 Months reading of 24.1% is now the highest in the comparison, a position taken from Classic Trend, and the trailing quarter is the best of the seven. Because the index reports intra-month, its weekly path is the most detailed record of June available. It stood at +1.35% MTD after the first week, when the payrolls-driven selloff pulled market after market lower together and short positioning paid. It lost 2.27 points on the year in the second week as equities and crypto rebounded and the metals reversed intraweek, with the third and fourth costing a further 0.10 and 0.50 points. Almost the whole month was decided in one reversal week, and the three that followed did not recover it.
SG CTA Index
The SG CTA Index returned -1.0% in June, the smallest loss in the comparison, holds the year-to-date lead at 9.4% and sits second behind SG Trend on the trailing quarter at 1.8%. The Last 12 Months return of 18.3% and the Sharpe of 0.33 sit at the lower end of the group, the standing trade-off of a construction that dilutes the trend signal across a wider factor set. That trade-off ran in the index’s favour for a second consecutive month. Its advantage appears when the dominant trend-following positions are the ones that break, because it holds less of them, and its disadvantage appears when those same positions run. June was firmly the former, and the index has now led the year-to-date table for two months on the strength of participating less fully in either direction.
TTU Trend Following Index
The TTU Trend Following Index returned -1.5% in June and sits at 8.6% year to date, third in the table, with a Last 12 Months reading of 23.1% second behind SG Trend. The maximum drawdown of 20.7% remains the highest in the comparison and the Sharpe of 0.36 near the lowest, the cost of sampling 47 programs across a wide volatility range. The June result illustrates the limit of manager diversification as a defence. Averaging a large ensemble reduces the influence of any one manager’s positioning, but cannot diversify away a market-level event: when the equity, precious metals and crypto trends all turn inside four weeks, nearly every constituent is on the wrong side of at least two. Breadth dilutes idiosyncratic error, not common error, and June’s error was common.
IASG Trend Following Index
The IASG Trend Following Index returned -1.5% in June and is at 7.0% year to date, second-lowest of the seven. IASG sits third over twelve months and second over two years, and its 69.1% return since 1 January 2020 and 8.4% CAGR are each second only to Classic Trend. The maximum drawdown of 13.2% is second-lowest in the group and now sits a clear margin ahead of Classic Trend, rather than the narrow edge it held a month ago. The MAR of 0.64 and Sharpe of 0.57 remain the strongest peer-relative readings outside Classic Trend. Across 50 constituents, IASG continues to pair the second-highest long-run return with the second-lowest drawdown, the most efficient combination of those two columns in the group.
Systematic Momentum CTA Index
The Systematic Momentum CTA Index returned -1.8% in June and is at 5.9% year to date, second-lowest in the comparison, sitting at the bottom of both medium-horizon tables. With 163 constituents it carries by far the broadest sampling of the systematic momentum universe, and the June result is the most direct evidence available that the month’s losses were structural rather than manager-specific: an index this broad cannot post a bottom-half month unless the positioning beneath it was common across the industry. The Sortino ratio of 0.92 remains the second-highest in the comparison.
June Market Narrative
June 2026 was a month in which the trend environment improved and trend followers paid for the improvement. The TTU Trend Barometer traced 43, 43, 45, 55 across the four weeks, recovering from May’s close at 32 and finishing at the threshold where Neutral gives way to a favourable environment. The gain came almost entirely from the downside. The petroleum complex broke down and kept breaking down for three consecutive weeks, the precious metals turned a spring pullback into a sustained decline, the equity indices ran to records through mid-month and then rolled over, and Bitcoin extended a decline that has run since the winter. Each week added trending markets to the count. Most of them were trending against the book the year had built.
Week ending 5 June: A hot payrolls print inverts the tape
The month opened with a single macro catalyst doing what four weeks of geopolitics had failed to do in May: aligning the entire board behind one driver. May payrolls came in near 172,000 against expectations near 88,000, with unemployment steady at 4.3%, and market pricing swung from a 2026 cut toward the possibility of a hike by year end. Treasury yields rose, the dollar reversed 1.21% higher with all seven counter-currencies lower, and Bonds eased 0.49% across the curve. Metals broke down 6.18%, Gold falling to its lowest level of 2026, Grains fell 5.40% with all eight contracts lower, and Bitcoin dropped 16.94%. Equities reversed 2.18% lower, the Nasdaq 100 off 4.79% in Friday’s session alone, the worst day for US technology since April 2025. Breadth ran 12 of 49 contracts higher. The barometer recovered from 32 to 43, back into Neutral, and the SG Trend Index rose to +1.35% MTD. It was the best week of the month. It was also a week in which almost everything fell.
Week ending 12 June: The reversal reverses
The second week undid the first at the contract level and left the barometer untouched. Equities rebounded 1.87%, the Nikkei 225 up 4.81% to a fresh high, and Bitcoin bounced 5.24%. The dollar handed back part of its surge and Bonds firmed 0.35%. Against that, the petroleum complex broke down hard, Energy the weakest sector at -3.75% with WTI off 6.25% and Brent 6.19%, the decline extending into Friday rather than stabilising. Metals eased 0.91% on a two-way split, the whole complex rallying sharply on Friday after closing lower on the week. The barometer held at exactly 43 for a second week, the trends broken and the trends opened roughly offsetting one another. The SG Trend Index did not hold. It gave back 2.27 points on the year, its month-to-date figure turning negative. The gap between a flat barometer and a falling index is the month in miniature, and this was the most expensive week of June.
Week ending 19 June: A split tape and a shallow cost
The third week divided by sector rather than lining up behind one driver. Soft Commodities led the board at +3.25% as Cocoa surged 11.56% and Coffee 7.01%, while the equity indices rose 2.15% with all seven contracts higher. Energy fell for a second week and Metals eased 2.48%. The barometer firmed 2 points to 45 even as contract breadth narrowed to 19 of 49 higher, which is precisely the distinction it is built to draw: it counts the strength and persistence of moves, not the number of markets closing up. The SG Trend Index slipped a further 0.10 of a point, the shallowest week of the month. The composition of the largest moves carried the more useful signal. The two biggest gains, Cocoa and Coffee, were counter-trend bounces off multi-month declines. The biggest loss, crude, ran with a trend already in place.
Week ending 26 June: Trend strength arrives on the downside
The final week produced the barometer’s largest move of the month and the clearest demonstration of why it had not paid. Metals were the weakest sector at -5.54%, Silver falling 10.63% as the precious complex deepened a decline that had begun as a pullback. Energy fell for a third consecutive week, Brent down 10.65%. The equity indices paused from records at -1.63%, the Nasdaq 100 off 4.40%, while Bitcoin extended lower and the dollar firmed again. The two largest gains on the board, Cocoa and Rough Rice, were both counter-trend. The barometer jumped 10 points to 55, its largest rise of the month, reaching the favourable boundary. The SG Trend Index fell a further 0.50 of a point. The week that most improved the trend environment was the week that most clearly showed why the improvement had not yet been paid out.
Implications for Index Construction and June Capture
The energy short was the month’s one clean, persistent contribution, and every construction in the comparison held it. That is a large part of why the losses cluster so tightly on the negative side of the ledger: the single trade that worked was not a differentiator. Differentiation came from the other side, where the positions being unwound were long equities and long precious metals, the two trends that had driven returns since the spring. How much an index lost in June was largely a function of how much of those two positions it carried, which in turn is a function of concentration. Classic Trend’s three constituents hold the market’s clearest trends in the largest size and gave back the most. The 163-constituent Systematic Momentum blend and the 20-constituent SG CTA carried the least, the first by averaging and the second by diluting the trend factor itself. The ranking of monthly losses almost perfectly follows that spectrum. Concentration amplified the reversals. Diversification diluted them.
The second implication concerns timing rather than construction. All four weeks fell inside a transition, and transitions carry a characteristic cost: the old trends break first, and the new ones become tradeable only once they have run far enough to generate a signal. A system’s entry rules determine how much of that gap it absorbs. Faster systems were short crude and short crypto early and carried those trends through the month. Slower systems held long equity and long metals exposure through the turn and were still reducing it as the month closed. Neither approach is wrong, and the difference between them is exactly the sort of variation a seven-index comparison exists to average away. In a transition month that variation temporarily becomes the dominant driver of dispersion, and the ranking it produces carries less information about skill than usual.
Closing Reflection
June delivered the worst month of the year for all seven indexes and the strongest month-end trend reading since April. Classic Trend fell furthest at -3.8% and holds the best trailing-quarter figure at +4.0%, the convexity argument compressed into two adjacent columns of the same table. SG CTA leads the year to date at +9.4%, SG Trend takes the twelve-month lead at +24.1%, and Classic Trend continues to lead every long-horizon and risk-adjusted measure at levels lower than a month ago.
Last month’s lesson was that volatility and opportunity are not the same thing. June’s is adjacent and less comfortable. Opportunity arriving and opportunity captured are not the same thing either, and the distance between them is where trend following does most of its losing. New trends are paid for out of old ones. An improving environment and a losing month are not in tension, then. They are the same event seen at two points along a lag. The consequence inverts the intuition most allocators bring to a monthly statement: the months in which conditions turn genuinely favourable will often look among the worst in the record, and the exposure decision they invite is the one most likely to be wrong.
About the Indexes
- SG Trend Index
Created by Société Générale, the SG Trend Index represents the largest trend-following CTA programs, focusing on systematic strategies with significant AUM. It captures broad market movements across various assets. More on SG Trend Index - Barclay BTOP50 Index
Managed by BarclayHedge, this index follows the largest investable CTAs, emphasizing diversification across major futures markets. It’s a widely referenced benchmark for managed futures. More on BTOP50 Index - TTU Trend Following Index
Developed by Top Traders Unplugged, the TTU TF Index includes programs with a 15-year track record, emphasizing resilience through experience and diversification across a large ensemble of programs. More on TTU TF Index - SG CTA Index
Another index by Société Générale, the SG CTA Index covers a broader array of CTA strategies, providing insight into the managed futures landscape beyond trend following alone. More on SG CTA Index - IASG Trend Following Index
This index, managed by IASG, tracks CTAs that primarily use trend-following strategies, offering a focused benchmark within the managed futures space. More on IASG TF Index - Classic Trend Index
The Classic Trend Index, curated by the Aussie Turtles, is a benchmark for traditional trend-following strategies, focusing on consistent, systematic approaches across diversified asset classes. More on Classic Trend Index - Systematic Momentum CTA Index
Managed by NilssonHedge, this index tracks CTAs focused on momentum-based strategies, providing a purist view of momentum trading within managed futures. More on Systematic Momentum CTA Index
Stay tuned for next month’s Battle of the Trend Following Indexes to see which benchmarks emerge as the top performers in the trend-following landscape.
Get the Aussie Turtles® Trend Following Guide
If you want to go deeper into the principles behind trend following and build a process that survives real market conditions, the Aussie Turtles® Trend Following Guide is now available on Amazon.
This book is a field manual for traders who want to move beyond prediction and commit to disciplined, systematic practice. Written by Adam Havryliv and Richard Brennan, it distills decades of experience into a practical and philosophical framework for navigating complex markets.
The guide challenges the myths of consistency and control. It explains why markets evolve through trader impact, serial correlation, and emergent structure rather than forecasts. It does not promise a holy grail system. Instead, it teaches the mindset required to capture the rare asymmetric outliers that drive long term performance.
If you are ready to trade with clarity, resilience, and conviction, this is the place to start. Click on the image below.