Battle of the Trend Following Indexes: May 2025
In the Battle of the Trend Following Indexes, we present a monthly update on some of the most respected trend-following benchmarks.

May 2025 Result
Six in the red. One in the green.
May was another tough month for trend followers — but this time, one benchmark stood tall. While six of the seven tracked indexes posted losses, the Classic Trend Index managed to finish the month up +0.1%, proving once again that trend purity can sometimes stand firm, even in chaotic seas.
The rest of the field continued to struggle. Though May’s losses were shallower than April’s, the Q2 trend vacuum remains unforgiving. Systems built to ride waves are still waiting for clean breaks.
Once again, Barclay BTOP50 offered the most defensive profile, with a mild -1.4% drop and continued leadership in drawdown control and monthly win rate.
Performance Highlights
Here’s how the indexes stacked up for May:
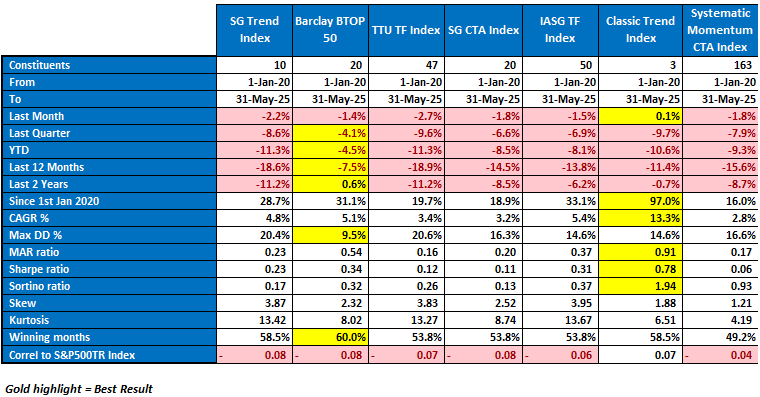
Classic Trend Index: The only index in positive territory, gaining +0.1% in May. Despite a bruising Q2, it remains the undisputed long-term champion: +97.0% since Jan 2020, 13.3% CAGR, and top marks in Sharpe (0.78), Sortino (1.94), and MAR ratio (0.91). Trend following in its purest form — and still the most potent.
Barclay BTOP50: Down just -1.4%, it continues to deliver consistency with only -4.5% YTD, the lowest max drawdown (9.5%), and the highest win rate (60.0%). A clear outlier in resilience.
TTU Trend Following Index: Fell -2.7%, now -11.3% YTD. The broad multi-program composition hasn’t shielded it from trendlessness.
SG Trend Index: Dropped -2.2%, matching TTU’s YTD decline of -11.3%. With a 20.4% drawdown and muted MAR (0.23), it continues to struggle with risk-adjusted efficiency.
SG CTA Index: Lost -1.8%, sitting at -8.5% YTD. Broader than trend-only strategies, but lacking any real upside in this regime.
IASG Trend Following Index: Down -1.5% in May and -8.1% YTD. Solid long-term CAGR of 5.4% and good Sortino (0.37), but recent returns have softened.
Systematic Momentum CTA Index: Declined -1.8% in May and -9.3% YTD. Pure momentum remains out of sync with current market dynamics.
Performance Snapshot
The VAMI chart still crowns the Classic Trend Index. After its sharp April drawdown, its May resilience helped it stabilize and retain its commanding lead. Its cumulative performance remains nearly double that of its peers.
The remaining six indexes continue to show clustered performance, emphasizing defensiveness over directional aggression. Among them, Barclay BTOP50 is the clear defensive outperformer.

Statistical Table
May’s updated data further reinforces these highlights:
Best CAGR: Classic Trend Index – 13.3%
Best MAR Ratio: Classic Trend Index – 0.91
Best Sharpe / Sortino: Classic Trend Index – 0.78 / 1.94
Lowest Max DD: Barclay BTOP50 – 9.5%
Most Winning Months: Barclay BTOP50 – 60.0%
The rest of the field posts moderate to low risk-adjusted returns, with no clear breakout performance YTD.
May Reflections
May didn’t offer full recovery — but it did give us a signal. Systematic trend models, especially those grounded in traditional price-based logic, can still shine through when noise subsides, even briefly.
The Classic Trend Index proved that edge isn’t always about magnitude — it’s about persistence. A +0.1% return in a sea of red is a small but important victory.
Meanwhile, the Barclay BTOP50 continues to provide ballast, showing why robustness matters when conviction is punished.
“When everyone else is sinking slowly, even treading water is leadership.”
About the Indexes
- SG Trend Index
Created by Société Générale, the SG Trend Index represents the largest trend-following CTA programs, focusing on systematic strategies with significant AUM. It captures broad market movements across various assets. More on SG Trend Index - Barclay BTOP50 Index
Managed by BarclayHedge, this index follows the largest investable CTAs, emphasizing diversification across major futures markets. It’s a widely referenced benchmark for managed futures. More on BTOP50 Index - TTU Trend Following Index
Developed by Top Traders Unplugged, the TTU TF Index includes programs with a 15-year track record, emphasizing resilience through experience and diversification across a large ensemble of programs. More on TTU TF Index - SG CTA Index
Another index by Société Générale, the SG CTA Index covers a broader array of CTA strategies, providing insight into the managed futures landscape beyond trend following alone. More on SG CTA Index - IASG Trend Following Index
This index, managed by IASG, tracks CTAs that primarily use trend-following strategies, offering a focused benchmark within the managed futures space. More on IASG TF Index - Classic Trend Index
The Classic Trend Index, curated by the Aussie Turtles, is a benchmark for traditional trend-following strategies, focusing on consistent, systematic approaches across diversified asset classes. More on Classic Trend Index - Systematic Momentum CTA Index
Managed by NilssonHedge, this index tracks CTAs focused on momentum-based strategies, providing a purist view of momentum trading within managed futures. More on Systematic Momentum CTA Index
Stay tuned for next month’s Battle of the Trend Following Indexes to see which benchmarks emerge as the top performers in the trend-following landscape.