Battle of the Trend Following Indexes: September 2026
The Battle of the Trend Following Indexes is our monthly comparison of the leading trend-following benchmarks. All figures are through 30 September 2026, with each index history rebased to 1,000,000 on 1 January 2020.

September 2026 Result
September was the strongest month of the current sequence for the peer group, and the most uneven. Six of the seven indexes gained, five of them by 3% or more. The TTU Trend Barometer opened the month at 55, crossed into the favourable band at 59 on 11 September for the first time in the period tracked, fell 14 points to 45 a week later and closed the month at 52. September therefore held both the best environment reading of the sequence and its sharpest single-week fall, and the return table carries the marks of both.
SG Trend led at +4.3%, followed by SG CTA at +4.1%, TTU at +3.8%, BTOP50 and Systematic Momentum at +3.0%, IASG at +1.2% and Classic Trend at -0.6%, the only loss in the group. The gap from best to worst widened to 4.9 percentage points from 2.5 in August, the widest of the four months since June. For a second month the ranking came close to inverting the one before it. The two strongest indexes in August, Classic Trend and IASG, were the two weakest in September. SG CTA rose from last to second and SG Trend from joint fifth to first.
This series reads the seven benchmarks along a convexity spectrum. An index built from few constituents carries the market’s clearest trends in larger size than a broad ensemble, which magnifies the gain when those trends persist and the loss when they break. On that frame, a strong month for trend should favour the concentrated end. September did not. The most concentrated index, with three constituents, finished last, and IASG, with 50 programs, finished sixth. The leaders were SG Trend with 10 constituents and SG CTA with 20, while the 163-constituent Systematic Momentum sat level with BTOP50 in the middle. Constituent count explains very little of September’s order.
The weekly record offers one reading consistent with the result, though not a proof of it. Persistence in September was concentrated and then interrupted. In the first fortnight it sat in a handful of places moving hard: the petroleum complex, where Crude Oil WTI rose more than 9% in each of the first two weeks, and Bonds, Metals and Equity Indices falling as complete blocs. In the second fortnight those blocs broke up, the petroleum contracts fell sharply from the upper end of their charts in the week to 25 September, and Grains and Copper pulled back at month end. A broad book holding many modest positions could collect the declines that persisted while absorbing the reversals in small size. A three-program index depends far more on which markets its programs held in size at the turning points, and the published data do not show those positions. Timing differences between three programs could produce a similar result.
SG Trend’s final figure of +4.3% sat slightly below its last weekly estimate of +4.47% on 25 September. In August the final print had landed more than a point above it.
The year-to-date table spread out sharply. SG Trend leads at 15.8%, with SG CTA at 15.6%, BTOP50 at 14.8% and TTU at 13.9%. A gap follows to Systematic Momentum at 11.5%, IASG at 8.7% and Classic Trend at 7.5%, now last. The range from first to last widened from 3.1 percentage points to 8.3 in a single month, reversing August’s compression. The trailing quarter now covers July to September. SG Trend leads it at +6.1%, and Classic Trend is last at +2.4%, with IASG at +2.9% close behind.
The long-run hierarchy held at the top. Classic Trend continues to lead total return, CAGR, MAR, Sharpe and Sortino since 1 January 2020, although its September loss trimmed most of them, with total return easing from 147.0% to 145.6% and Sharpe from 0.84 to 0.82. Beneath it the order changed. SG Trend’s total return rose to 72.5%, opening a 6.5-point lead over IASG at 66.0% after a month in which the two were separated by one-tenth of a point. Every maximum drawdown is unchanged. BTOP50 retains the shallowest at 9.7%, the highest share of winning months at 63.0% and the strongest Last 2 Years return at 19.7%.
Performance Highlights
Here is how the seven indexes came through September:
SG Trend Index
September: +4.3%, the strongest result in the group, after finishing joint fifth in August. Trailing quarter: +6.1%, best of the seven. YTD: +15.8%, now the outright leader. Its Last 12 Months return of 21.3% leads the group for a fourth straight month. Since 2020, SG Trend has gained 72.5% at an 8.4% CAGR, second only to Classic Trend, with a 20.4% maximum drawdown. Its MAR rose to 0.41 and its Sharpe to 0.52, level with IASG.
SG CTA Index
September: +4.1%, second, after the smallest gain in the group in August. Trailing quarter: +5.7%. YTD: +15.6%, second and 0.2 percentage point behind SG Trend. Since 2020, the index has gained 50.0% at a 6.2% CAGR with a 16.3% maximum drawdown. Its Sharpe improved to 0.39, while its Sortino of 0.11 remains the lowest of the seven. Its Last 12 Months return of 18.7% now ranks third.
TTU Trend Following Index
September: +3.8%, third. Trailing quarter: +5.4%. YTD: +13.9%, fourth. Since 2020, TTU has gained 56.3% at a 6.8% CAGR with a 20.7% maximum drawdown, still the deepest in the group. Its Last 12 Months return of 19.8% is second only to SG Trend. Unlike August’s, the September figure reconciles with the year-to-date and since-2020 columns.
Barclay BTOP50 Index
September: +3.0% as reported, level with Systematic Momentum in fourth. Trailing quarter: +5.8%, second. YTD: +14.8%, third. Since 2020, BTOP50 has gained 62.5% at a 7.5% CAGR. It holds the lowest maximum drawdown at 9.7%, the highest share of winning months at 63.0% and the strongest Last 2 Years return at 19.7%. Its MAR of 0.76 and Sharpe of 0.59 are second only to Classic Trend. Its other columns imply a September return nearer 3.3%, as the note below the table sets out.
Systematic Momentum CTA Index
September: +3.0%, level with BTOP50. Trailing quarter: +5.2%. YTD: +11.5%, fifth, having moved off the bottom of the table. Since 2020, the index has gained 43.3% at a 5.5% CAGR with a 16.7% maximum drawdown. Its Sortino of 0.91 remains second-highest among the seven, and its correlation to the S&P 500 Total Return is 0.00.
IASG Trend Following Index
September: +1.2% as reported, sixth, after finishing second in August. Trailing quarter: +2.9%. YTD: +8.7%, sixth. Since 2020, IASG has gained 66.0% at a 7.8% CAGR and now sits third on total return, 6.5 points behind SG Trend. Its 15.7% maximum drawdown remains the second-lowest in the comparison, and its MAR of 0.50 ranks third. The monthly figure does not reconcile with the other columns, all of which imply a September return nearer 0.4%. The note below the table sets this out.
Classic Trend Index
September: -0.6%, the only loss in the group, after leading August. Trailing quarter: +2.4%, the weakest. YTD: +7.5%, back to last. Since January 2020, Classic Trend has gained 145.6% at a 14.2% CAGR, twice the next-highest total return. It retains the strongest MAR at 0.90, Sharpe at 0.82 and Sortino at 1.35. Maximum drawdown is unchanged at 15.8%, and its +0.11 correlation to the S&P 500 Total Return remains the only positive reading in the group.
Performance Snapshot
The table below compares the seven trend-following indexes through 30 September 2026. Gold highlights the leading values where a clear performance comparison is useful.
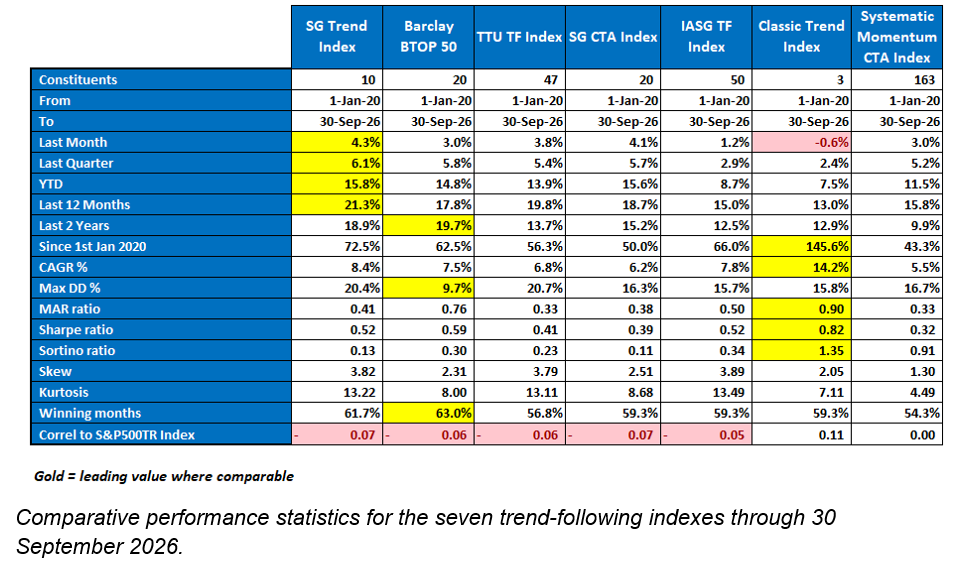
A note on comparability. Four of the seven indexes, SG Trend, SG CTA, TTU and Classic Trend, reconcile across the monthly, year-to-date, since-2020 and trailing-quarter columns when set against the August edition. Three do not. IASG shows the largest gap. Its reported +1.2% would imply year-to-date and since-2020 figures of roughly 9.6% and 67.3%, against the 8.7% and 66.0% shown, and all three longer columns instead imply a September return of about 0.4%. The same columns are equally consistent with August having been revised from +5.1% to about +4.3%, with September at +1.2% as reported, and the published table cannot tell the two apart. BTOP50 shows a smaller version of the pattern, with its columns implying about 3.3% against the 3.0% reported. Systematic Momentum shows a smaller one again, implying about 3.2%. None of these changes the month’s order in any material way. At 0.4% IASG would still sit sixth, and BTOP50 and Systematic Momentum would be fourth and fifth rather than joint fourth. TTU’s August discrepancy remains unclarified, although its trailing-quarter figure sits closer to the 3.0% August return implied last month than to the 3.6% reported.
Performance Since 1 January 2020
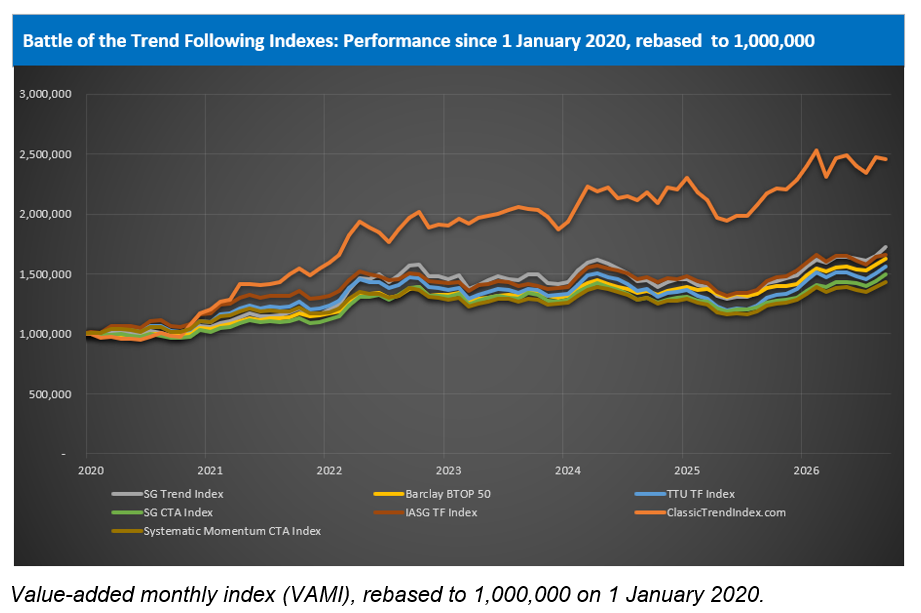
The chart below plots the value-added monthly index (VAMI) for all seven benchmarks, rebased to 1,000,000 on 1 January 2020. Classic Trend remains well clear of the peer group over the full period, but September’s small decline is visible at the right-hand edge, leaving it further from its February peak while the peer lines turn higher. Beneath it, SG Trend has pulled away from IASG to lead the peer cluster, a month after the two had converged.
Performance Commentary
SG Trend Index
SG Trend returned +4.3% in September, leads YTD at +15.8% and holds the twelve-month lead at +21.3%. Its weekly estimates show where the month was made. Most of the gain came in the second week, when the petroleum complex extended and Bonds, Metals and Equity Indices fell as complete blocs, and in the fourth, when the precious metals and Bonds resumed their declines. The third week, when those blocs broke up, added less than half a point. With 10 constituents drawn from the largest trend programs, SG Trend sits between the concentrated and broad ends of the group, and in September that position was the one most rewarded.
SG CTA Index
SG CTA returned +4.1% in September, second in the group, and sits 0.2 percentage point behind SG Trend on YTD at +15.6%. In the July edition we noted that SG CTA had led the losing stretch by participating less, and in August that it trailed the recovery only modestly. September fits neither description. An index that blends trend with a broader set of systematic strategies gained nearly as much as the large-manager trend benchmark in a strong month for trend. The published data do not separate its trend and non-trend components, so whether the other strategies added to the month or simply did not detract cannot be determined.
TTU Trend Following Index
TTU returned +3.8% in September and stands at +13.9% YTD, fourth. Its 47-program ensemble finished ahead of BTOP50 and the 163-constituent Systematic Momentum, and well ahead of the 50-program IASG. That last comparison is the more informative one. The two broadest manager ensembles in the group moved almost together through July and August, losing more than most and then recovering more than most. In September they separated by 2.6 percentage points as reported, or about 3.4 on IASG’s implied figure. Their breadth of construction is similar, so the gap points to the manager mix inside each ensemble rather than the number of programs it holds.
Barclay BTOP50 Index
BTOP50 returned +3.0% in September and sits third on YTD at +14.8%, with the second-best trailing quarter at +5.8%. The index is an equally weighted, annually rebalanced selection of the largest investable CTA programs. Across July to September that construction produced the steadiest path in the group: the smallest loss in July, a middling share of August’s recovery and a solid share of September’s gains. Its Last 2 Years return of 19.7% leads outright, and its Sharpe of 0.59 has moved clear of the peer group. If the 3.3% implied by its other columns proves correct, it sits fourth outright for the month.
Systematic Momentum CTA Index
Systematic Momentum returned +3.0% in September and moves off the bottom of the YTD table to fifth at +11.5%. For a third month its 163 constituents produced a result near the middle of the group: a small loss in July, close to the peer median in August and level with BTOP50 in September. A wide constituent base should narrow outcomes in both directions, and three months of results fit that description. In September it also meant capturing 1.3 percentage points less than the 10-constituent SG Trend. Its 0.00 correlation to the S&P 500 Total Return remains the most neutral reading in the comparison.
IASG Trend Following Index
IASG returned +1.2% as reported in September, sixth in the group, after finishing last in July and second in August. Seventh, second and sixth is the widest swing in monthly placing in the comparison apart from Classic Trend. For the second time in three months IASG’s figures require a comparability note, and allocators may want to treat its latest monthly print as provisional until the series settles.
Classic Trend Index
Classic Trend returned -0.6% in September, the only loss in the comparison, and falls back to last on YTD at +7.5%. Its three monthly results now read -2.2%, +5.3% and -0.6%, the widest range of any index. September is the hardest of the three to read. In July and August the index moved with the direction of the month, losing more in a losing month and gaining more in a recovering one. In September it lost in the strongest month for its peers in the sequence. Its long-run lead is intact, though trimmed.
September Market Narrative
September was a month of concentration followed by interruption. The TTU Trend Barometer read 55, 59, 45 and 52 across the four weeks ending in September, then held at 52 in the week that straddled the month end. The count of markets finishing each week higher read 24, 14, 18 and 24 of 49, then 14. As in August, the two measures did not move together. The barometer reached its highest reading in the week when the fewest markets rose, and fell furthest in a week when more markets rose than the week before. The barometer counts markets trending in either direction, and much of September’s persistence ran downward, in Bonds, the precious metals and Soft Commodities. SG Trend’s estimated return tracked the barometer more closely this month than last.
Week ending 4 September: Energy carries the board as the barometer holds
The first week, which also included the final session of August, belonged to Energy. The sector gained 5.95% with all six contracts higher, Crude Oil WTI up 9.69% and Brent 9.28%, the largest gain by any multi-contract sector in the sequence to that point. Breadth barely changed, from 21 to 24 of 49, and the barometer held at 55. Elsewhere the declines were numerous but small. Bonds fell across all four maturities for the first time in five weeks, with the declines growing with maturity, Metals fell for a second week and the VIX for a seventh. Grains paused after the prior week’s sweep, with Wheat giving back 6.38%. SG Trend opened September at +0.59%. Its year-to-date figure rose 2.04 points in the week, but most of that belonged to the close of August rather than to September.
Week ending 11 September: Fewer markets rise and the barometer reaches 59
Only 14 of 49 contracts finished higher, ten fewer than a week earlier and the narrowest upside breadth in the period tracked. The barometer rose 4 points to 59 regardless, its first reading inside the favourable band. The petroleum complex extended, with WTI up 9.37%, Heating Oil 9.23% and Brent 8.65%, the three largest gains on the board, while the cattle pair rose more than 3% each. Most of the rest fell, and much of it fell as blocs: Bonds across all four maturities again, Metals across all five for a third week and Equity Indices across all seven. Sixteen contracts in three sectors moved in one direction. SG Trend rose to +2.79% for the month, a weekly gain of about 2.2 percentage points and the largest of the sequence. Markets falling in the direction of structures already in place contributed as much to that gain as the petroleum advance.
Week ending 18 September: The blocs break and the barometer falls 14 points
Breadth improved to 18 of 49, and the barometer fell 14 points to 45, back in Neutral a week after entering the favourable band. The blocs that had carried the previous week broke up. Metals turned higher on four of five contracts, the 30 Year Bond rose while the shorter maturities fell, and Equity Indices split. Leadership in Energy rotated away from the crude pair, which stalled, to Gasoline RBOB and Natural Gas. Only Soft Commodities, down 5.19% across all six contracts with Cocoa down 10.64%, and Meats, down across all three, moved as complete sectors, nine contracts against sixteen. Oats broke to the highest level on its chart with a 7.26% gain. SG Trend added about 0.4 percentage point to reach +3.23%. Its weekly gain shrank in the same week the reading fell, rather than lagging it as in August.
Week ending 25 September: The leaderboard turns over and the structures hold
Six of ten sectors changed sign. Soft Commodities and Meats, the two weakest a week earlier, finished first and second, while Energy, Metals and Bitcoin moved toward the bottom of the table. The petroleum contracts supplied three of the five largest declines, Heating Oil down 7.72%, Gasoline RBOB 4.04% and WTI 3.82%, as the advance that had carried them to the upper end of their charts gave ground. Beneath that turnover, most of the previous week’s interruptions reversed. Silver, Gold, Platinum and Palladium resumed declines running since February, Bonds fell across all four maturities to new lows, and Rough Rice, Soybean Meal and Oats reached the highest levels on their charts. Breadth rose to 24 of 49, the barometer recovered 7 points to 52, and SG Trend climbed to +4.47%, a weekly gain of about 1.2 percentage points. This was the one week of the month in which the largest moves ran against the sector that had led the first three.
28 to 30 September: The final sessions
The last three sessions of September fell inside the week reported on 2 October, so the weekly sector data cannot isolate them. That week was the narrowest of the month, with only 14 of 49 contracts higher. Metals fell 5.45% as Copper joined the precious metals lower, Grains fell 2.84% as Soybean Meal, Soybeans and Corn pulled back from their highs, and the US Dollar Index cleared its summer high. The barometer held at 52. SG Trend’s year-to-date figure ended the week 0.33 point lower, its first weekly decline in eight weeks. The index figures give an outline of how that divided. The estimate stood at +4.47% on 25 September and the published September return is +4.3%, which places the cost of the final sessions, together with any revision, at roughly 0.2 percentage point. October’s first two sessions account for most of the remainder at -0.08%.
Implications for Index Construction and September Capture
June’s losses came from transition, July’s from trends that died before they matured and August’s recovery from trends that finally lasted. September supplied the most return of the four months but distributed it unevenly in time and across sectors: concentrated and coherent in the first fortnight, interrupted in the third week, and repaired in the fourth everywhere except Energy. Dispersion widened to 4.9 percentage points, the widest of the sequence, and the ranking did not follow the construction spectrum.
Last month we suggested reading the table in pairs, since the July and August results largely offset. August and September do not. Across the two months, TTU and SG Trend lead at about 7.5% and 7.3%, while Classic Trend trails at about 4.7%. The full quarter now spans a loss, a recovery and a strong month, the cycle the August edition argued for evaluating. Over it, the spread is 3.7 percentage points, and the two indexes with the widest monthly swings of the summer, Classic Trend and IASG, finished last. Whether that reflects construction or the particular markets each index held in a quarter full of reversals cannot be settled with three months of data. The long-run columns cover 81 months, and on those Classic Trend still leads every return and return-to-risk measure shown.
The second lesson concerns timing. In August the barometer led and SG Trend’s estimated return followed late. In September they moved largely together, with weekly gains of about 0.6, 2.2, 0.4 and 1.2 percentage points against readings of 55, 59, 45 and 52. The largest gain came with the highest reading and the smallest with the steepest fall. One month does not establish a relationship, and whether the barometer and returns stay this closely aligned will say more about its usefulness as a monthly guide than either August or September can alone.
Closing Reflection
September delivered gains for six of the seven indexes, the strongest peer-group month of the sequence, a barometer that touched the favourable band before falling back into Neutral, and a second consecutive near-inversion of the monthly ranking. SG Trend led at +4.3% and now leads YTD at 15.8% and the twelve-month column at 21.3%. Classic Trend was the only index to lose money, at -0.6%, and fell to last on YTD. BTOP50 retains the lowest drawdown at 9.7% and the strongest two-year return, and Classic Trend the long-horizon return and return-to-volatility statistics shown here.
The month’s most useful finding is that a strong month for trend did not organise the indexes by construction. The spread widened to 4.9 percentage points, yet the leaders sat toward the middle of the constituent range, the most concentrated index finished last, and two ensembles of similar breadth, TTU and IASG, finished 2.6 points apart. Manager mix and market exposure explained more of September than headcount did.
For allocators, the completed quarter offers the loss-and-recovery cycle that last month’s edition suggested waiting for, with a strong month added. SG Trend, BTOP50 and SG CTA delivered between 5.7% and 6.1% over it, and the two indexes with the widest monthly swings delivered the least. That is one quarter set against an 81-month record in which the concentrated construction remains ahead on every long-run measure, and the next cycle will show which of the two readings carries more weight.
About the Indexes
- SG Trend Index
Created by Société Générale, the SG Trend Index represents the largest trend-following CTA programs, focusing on systematic strategies with significant AUM. It captures broad market movements across various assets. More on SG Trend Index - Barclay BTOP50 Index
Managed by BarclayHedge, this index follows the largest investable CTAs, emphasizing diversification across major futures markets. It’s a widely referenced benchmark for managed futures. More on BTOP50 Index - TTU Trend Following Index
Developed by Top Traders Unplugged, the TTU TF Index includes programs with a 15-year track record, emphasizing resilience through experience and diversification across a large ensemble of programs. More on TTU TF Index - SG CTA Index
Another index by Société Générale, the SG CTA Index covers a broader array of CTA strategies, providing insight into the managed futures landscape beyond trend following alone. More on SG CTA Index - IASG Trend Following Index
This index, managed by IASG, tracks CTAs that primarily use trend-following strategies, offering a focused benchmark within the managed futures space. More on IASG TF Index - Classic Trend Index
The Classic Trend Index, curated by the Aussie Turtles, is a benchmark for traditional trend-following strategies, focusing on consistent, systematic approaches across diversified asset classes. More on Classic Trend Index - Systematic Momentum CTA Index
Managed by NilssonHedge, this index tracks CTAs focused on momentum-based strategies, providing a purist view of momentum trading within managed futures. More on Systematic Momentum CTA Index
Stay tuned for next month’s Battle of the Trend Following Indexes to see which benchmarks emerge as the top performers in the trend-following landscape.
Get the Aussie Turtles® Trend Following Guide
If you want to go deeper into the principles behind trend following and build a process that survives real market conditions, the Aussie Turtles® Trend Following Guide is now available on Amazon.
This book is a field manual for traders who want to move beyond prediction and commit to disciplined, systematic practice. Written by Adam Havryliv and Richard Brennan, it distills decades of experience into a practical and philosophical framework for navigating complex markets.
The guide challenges the myths of consistency and control. It explains why markets evolve through trader impact, serial correlation, and emergent structure rather than forecasts. It does not promise a holy grail system. Instead, it teaches the mindset required to capture the rare asymmetric outliers that drive long term performance.
If you are ready to trade with clarity, resilience, and conviction, this is the place to start. Click on the image below.