Rising Stars and Trend Titans: May 2025
Welcome to Rising Stars and Trend Titans — your monthly lens into this dynamic space, spotlighting standout performers across the spectrum of globally diversified, rules-based trend-following programs.

Introduction
The world of systematic trend following remains in a defensive crouch, with May 2025 extending the pain from April’s historic rout. While this month didn’t match April’s velocity of losses, it delivered more of the same: elusive trends, sharp reversals, and a market tone that continues to punish directional conviction.
In May, we evaluate the performance of 113 programs, each with a minimum five-year verified track record. Our coverage spans the spectrum: institutional titans with decades of data, and emerging managers whose resilience is carving new space on the leaderboard. Together, they offer a broad and nuanced view of what systematic trend following looks like in both feast and famine.
This month, we introduce a new diagnostic lens: The Trend Environment Model Portfolio.
Powered by CSI out-of-sample data and structured as an ensemble of 10 trend-following systems (ranging from short to long-term models), this aggressive portfolio tracks performance across 68 liquid futures markets. It offers allocators and researchers an objective, model-based context for the conditions faced by managers each month — acting as a climate barometer for trend durability, trend breadth, and volatility structure.
May’s reading? Another difficult chapter.
Only 36 of 68 markets were active, with tepid trends in equity indexes like the Nasdaq 100 and DAX offering slim positive contributions. Elsewhere, trend signals fragmented. Robusta Coffee, which once led the charge, experienced a violent reversal — a stark illustration of the whipsaws plaguing many systems. While the monthly portfolio return came in at –1.86%, it was the ongoing YTD drawdown of –12.34% that reinforced the brutal nature of 2025 to date.
Context is critical. From January 2020 through to May 2025, the aggressive model portfolio delivered over +162% cumulative return, reflecting a historically favourable regime for trend following. The sharp contrast of 2025 highlights just how regime-sensitive trend following remains — thriving in persistence, struggling in chaos.
This report, as always, goes beyond rankings. It tells a story — of drawdowns and discipline, of outliers and adaptation. We spotlight those managers who continue to stand tall, compound capital, and redefine robustness under pressure.
Let’s assess the battlefield, revisit the benchmarks, and honour those Rising Stars and enduring Titans who continue to push the edge of what systematic trend following can achieve.
Criteria for Inclusion
The “Rising Stars and Trend Titans” blog evaluates globally diversified systematic trend-following programs that meet specific criteria to ensure consistency, reliability, and relevance. Here’s what makes a program eligible for inclusion:
- Validated Track Record:
Only programs with a minimum of five years of performance history are considered. This ensures that the strategies have been tested across varying market conditions and are not short-term anomalies. - Global Diversification:
Programs must demonstrate diversification across multiple asset classes, including equities, fixed income, commodities, and currencies. This ensures their ability to capture trends across a wide spectrum of markets. - Systematic Approach:
All included programs must follow a systematic, rules-based approach to trend following, eliminating discretionary bias and focusing on process-driven decision-making. - Performance Reporting:
Programs must provide consistent, validated monthly performance data. The data is drawn from the widely respected Nilsson Hedge Database, ensuring accuracy and credibility. - Program Scope:
While established players are naturally included, we also feature rising stars who may have shorter overall histories but have achieved standout results within the five-year threshold. This focus ensures a balanced view of the established and emerging talent in the industry.
For a full listing of the programs featured in this month’s report, Database List May 2025
Trend Environment Snapshot – Powered by the CSI Model Portfolio
Understanding the success or struggle of systematic trend-following managers requires more than just performance tables — it demands context. For that reason, we introduce the CSI Model Portfolio, a 68-market, out-of-sample portfolio powered by an ensemble of 10 pure trend-following systems across short, medium, and long timeframes.
This model, aggressively configured to extract edge from directional persistence, serves as a diagnostic indicator for the underlying health of the trend-following regime each month.
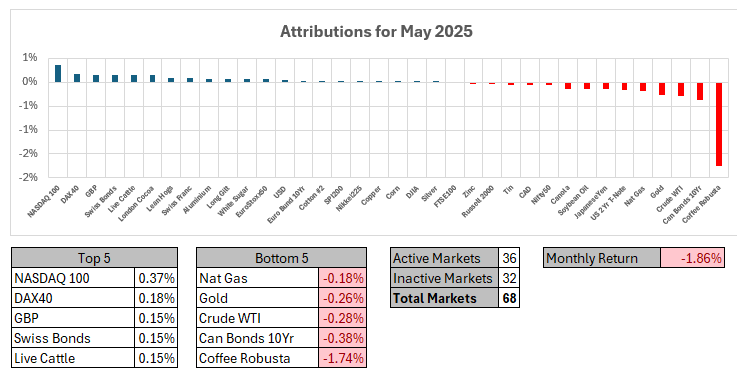
May offered little relief after April’s brutal reversal. The model posted a monthly return of –1.86%, confirming continued headwinds across the trend-following landscape.
Only 36 of 68 markets were active — a narrow breadth. Of those, only a few offered meaningful contributions to the upside:
- NASDAQ 100 (+0.37%) led the way, with DAX (+0.18%), GBP (+0.15%), Swiss Bonds (+0.15%), and Live Cattle (+0.15%) contributing modest gains.
- But this small cohort of winners was overwhelmed by losses elsewhere — particularly in energy, soft commodities, and fixed income.
- The bottom of the chart was dominated by Robusta Coffee (–1.74%), which saw a violent trend reversal after previously being one of the strongest markets YTD.
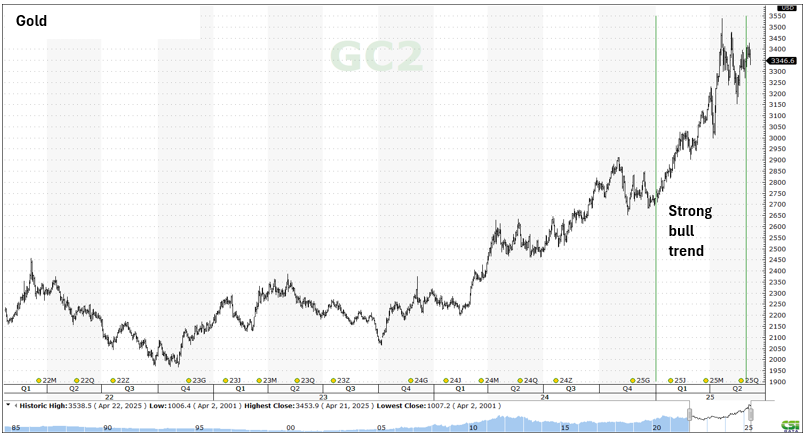
- Other notable detractors included Canada Bonds (–0.38%), Crude WTI (–0.28%), and Gold (–0.26%) — all representative of failed breakouts or trend collapses.
The limited number of active signals and their low conviction (even among winners) speaks to the core challenge: in a month where trends were scarce, false starts and sharp whipsaws defined the playing field.
This climate punished trend systems with exposure to extended soft commodity trades and bond reversals. Even models with typically reactive structures struggled to adjust fast enough to the shifting momentum landscape.
As a standalone signal, –1.86% monthly return from this model may seem harsh — but it’s not just a number. It represents the drag imposed by trend fragility, low signal quality, and a fractured macro backdrop that continues to confound trend definitions.
Spotlight: NASDAQ 100 – A Lone Trend Beacon in a Fragmented Field
Among a sea of false signals and stalled trends, NASDAQ 100 futures stood out as the top-performing market in the model portfolio for May, contributing +1.11%. But its path to the top was anything but smooth.
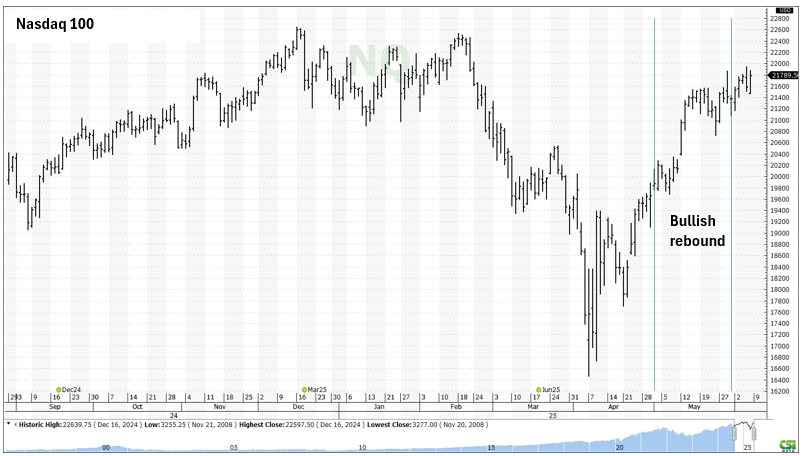
As the chart shows, the NASDAQ 100 clawed its way upward following a violent Q1 sell-off. The bounce that began in late April extended into May, allowing medium-term and reactive trend systems to re-enter long positions — or stay long through the rebound. The resulting move delivered just enough directional persistence to offer a modest payoff.
Key characteristics of this trend:
- Smooth recovery from the March–April lows, without triggering major whipsaws during the ascent.
- Low volatility ascent that favoured models with medium-speed breakout entries or trailing stop mechanisms.
- Lack of competition — the rest of the futures complex offered little support in May, which made this isolated uptrend stand out more clearly.
Still, it’s important not to overstate the strength of the signal. The +0.37% return, while leading the pack, speaks to how weak the overall environment was. In a more favourable regime, top contributors might deliver 4 to 5 times that value or more. But in May, NASDAQ 100 was less a sign of strength than a relative survivor.
Spotlight: Robusta Coffee – From Hero to Hazard
If NASDAQ 100 was the bright spot in a dim field, Robusta Coffee was the sharp edge of the blade. After months of powerful upside that delivered some of the strongest gains in the model’s 2024–early 2025 profile, May saw that entire narrative flip.
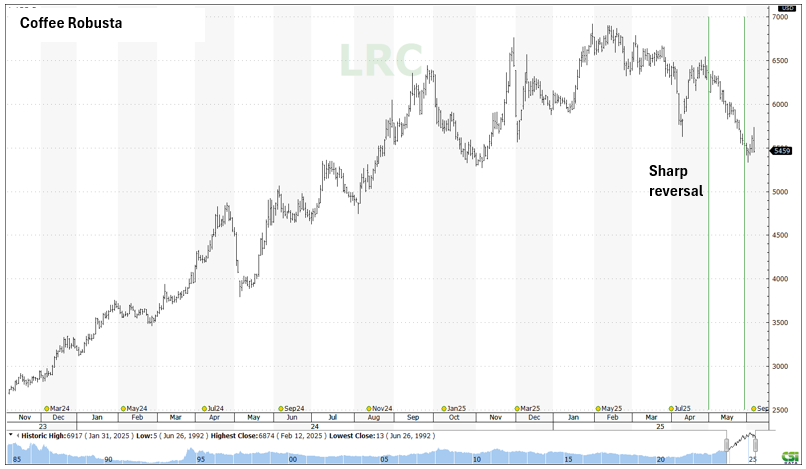
Robusta Coffee posted a brutal –1.74% monthly attribution — the single largest detractor in the CSI Model Portfolio for May. The chart tells the story with jarring clarity:
- The uptrend that extended into Q1 2025 broke down violently, catching many trend-following systems still holding long.
- A cascade of selling followed — likely triggering exit signals in stages depending on the model’s reactivity, but not before significant damage was done.
- For slower models, which tend to lag reversals, the move was particularly punishing. Many were still long and exposed during the steepest leg down.
The collapse of Robusta is a textbook example of trend reversal whiplash — a condition that trend followers are structurally exposed to, particularly when extended moves retrace rapidly without forming counter-trends.
It’s also emblematic of the broader regime breakdown we’re witnessing in 2025:
- What had been the strongest trending asset year-to-date is now a source of max drawdown.
- The reversal was not part of a broader sector shift (i.e., softs didn’t all collapse in unison) — it was isolated and sharp, a trap for conviction systems.
This is the kind of move that doesn’t just test models — it tests conviction, portfolio construction, and discipline.
Year-to-Date Attribution – CSI Model Portfolio (as of May 2025)
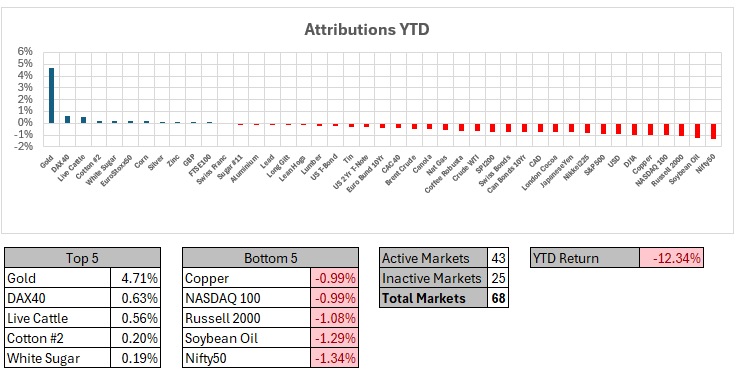
While monthly drawdowns can sting, it’s the year-to-date trajectory that reveals the depth and persistence of the 2025 regime challenge for trend-following systems. With just 43 of 68 markets active, and a YTD return of –12.34%, the CSI Model Portfolio now reflects one of the most hostile stretches for trend models since inception.
Key Observations:
Top Contributors – A Shrinking Island of Gains
- Gold (+4.71%) remains the clear standout — not only leading for May but anchoring the YTD leaderboard. It’s one of the few sustained trends that trend-following models have been able to ride successfully this year.
- Modest gains also emerged in:
- DAX (+0.63%)
- Live Cattle (+0.56%)
- Cotton #2 (+0.20%)
- White Sugar (+0.19%)
These gains, while positive, are small and isolated — insufficient to counter the broader drag across the portfolio.
Bottom Detractors – Trend Traps and False Starts
- The bottom of the board paints a clear picture of false breakouts and volatility collapses:
- Nifty50 (-1.34%), Soybean Oil (–1.29%), Russell 2000 (–1.08%), NASDAQ 100 (–0.99%) and Copper (–0.99%) round out the bottom five.
- Notably, equity index trends have flipped violently multiple times in Q1 and Q2, generating whipsaw losses rather than trend participation.
- Commodities and metals, usually trend-friendly sectors, have instead offered inconsistent signals and frequent mean reversion.
Structural Takeaways
- Breadth is vanishing: Only 43 active markets remain in the model — a key signal of trend signal exhaustion and environment deterioration.
- The YTD return of –11.77% is not just a performance stat — it’s a warning light. Despite historically strong 5-year results, the model now sits in a max drawdown phase that underscores how fragile momentum structures can become when volatility regimes shift.
- This is a rare moment where even a diversified, multi-speed ensemble is being starved of signal and punished by reversals — the ultimate stress test for any trend system.
What This Means for Readers
2025 is shaping up as a masterclass in regime adaptation. For allocators, this YTD profile:
- Reinforces the value of capital preservation overlays, volatility targeting, or adaptive risk budgeting.
- Highlights the importance of multi-speed trend ensembles, which may not prevent drawdowns but can mute extremes.
- Emphasizes that long-term success in trend is inseparable from survivability during dry spells.
The model isn’t broken. But it is bleeding — and that tells us everything we need to know about the current environment.
From Climate to Combat: Assessing Individual Strategy Resilience
While the Model Portfolio outlines the broader trend-following climate — hostile, fragmented, and trend-starved — the real insight emerges when we examine how individual managers are navigating these conditions. The Rising Stars and Trend Titans covered in the remainder of this report are not passive recipients of regime pressure — they are builders of systems, interpreters of price, and survivors of structural strain.
Some leaned defensive, prioritizing capital preservation. Others stayed aggressive, betting on asymmetric payoffs. A few even thrived — not because the environment was favourable, but because their design was durable.
Let’s move from the macro lens to the manager level — to see who endured, who adapted, and who advanced.
Benchmark Performance Overview – May 2025
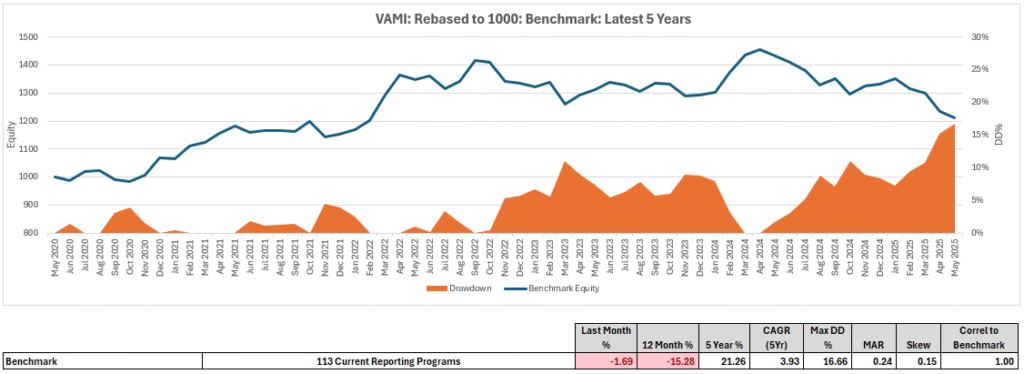
May 2025 delivered another down month for systematic trend followers, with the benchmark this month tracking 113 globally diversified programs — declining by –1.69%. While not as extreme as April’s drawdown of –5.37%, the cumulative pressure continues to mount across the space.
Over the trailing 12 months, the benchmark is now down –15.28%, solidifying 2025 as one of the most challenging periods for trend systems since the COVID shock. The pain is structural, not episodic — a function of regime instability, volatility compression, and trend decay across asset classes.
The 5-year cumulative return remains positive at +21.26%, translating to a compound annual growth rate (CAGR) of 3.93%. But persistent drawdowns have now widened to a maximum of –16.66%, dragging the Managed Account Ratio (MAR) to 0.24 — a further decline from April’s 0.25.
Key Stats (as of May 2025):
- Last Month Return: –1.69%
- Trailing 12-Month Return: –15.28%
- 5-Year CAGR: 3.93%
- Max Drawdown: –16.66%
- MAR Ratio: 0.24
- Skew: +0.15 (slightly positive, indicating convexity remains possible)
- Correlation to Model Portfolio: 1.00
The Value-Added Monthly Index (VAMI) chart shows a portfolio struggling to recover from late-2024 highs. The drawdown zone deepened throughout 2025, with equity declining and volatility increasing. The rolling equity curve has failed to stabilize — indicating trend followers are still being whipsawed more often than rewarded.
This benchmark remains a vital lens. While it doesn’t predict which strategies will thrive next, it reveals the terrain — and this terrain is still harsh. The resilience of certain programs amid these conditions becomes all the more impressive when viewed through this macro lens.
Top 10 List: Month Performance for May 2025
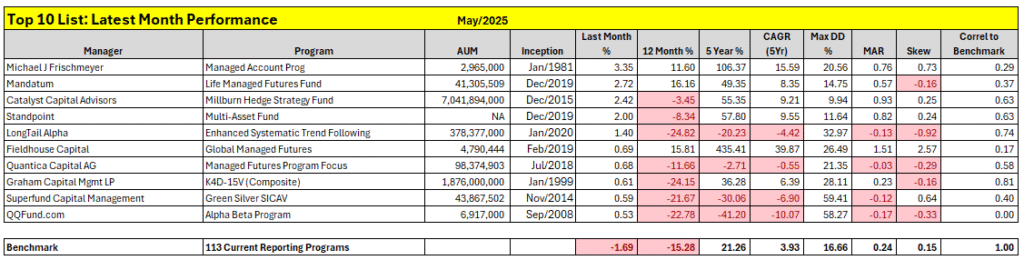
May offered only a modest reprieve from April’s damage, but for a few select programs, it was a month of quiet resilience. While the benchmark declined another –1.69%, the top ten managers posted positive results — navigating the trend-starved landscape with agility, structural diversity, or exposure to the handful of working signals like equity index rebounds and idiosyncratic commodity setups.
Michael J Frischmeyer’s Managed Account Program once again led the pack with a +3.35% return, reinforcing its reputation as a durable legacy model. With a 5-year CAGR of 15.59%, a Max DD of 20.56%, and a MAR of 0.76, it continues to demonstrate the staying power of classic, long-duration trend systems.
Coming in second, Mandatum’s Life Managed Futures Fund delivered +2.72% — extending its 12-month return to +16.16%. With a well-balanced profile (5-year CAGR: 8.35%, Max DD: 14.75%), it continues to showcase a robust return-to-risk profile in adverse conditions.
Rounding out the top three, Catalyst Capital Advisors’ Milburn Hedge Strategy Fund returned +2.42%, bouncing back after a rough 12-month period. The program’s long-term metrics (5-year CAGR: 9.21%, MAR: 0.93) affirm its structural edge despite short-term noise.
Other noteworthy performers:
- Standpoint’s Multi-Asset Fund posted a solid +2.00%, providing steady ballast amid volatility, even as its 12-month return sits at –8.34%.
- LongTail Alpha’s Enhanced Systematic Trend Following strategy managed +1.40%, but remains deep in drawdown territory YTD (–24.82%), with a negative MAR of –0.13 — a reminder that monthly gains don’t always reflect structural health.
- Fieldhouse Capital, Quantica Capital AG, and Graham Capital Management all delivered modest gains between +0.53% and +0.69%, despite wrestling with steep trailing losses over the past year.
- Superfund Capital Management’s Green Silver SICAV returned +0.59%, while QQFund.com’s Alpha Beta Program added +0.53%, rounding out the leaderboard with slight but positive performance.
These results continue to reflect model diversity in a fractured environment. The strategies on display span multi-asset allocations, volatility targeting, and legacy trend logic — with varying degrees of exposure to failed breakouts, commodity reversals, and equity rebounds.
A note on classification:
While several of these programs may not conform strictly to classic trend-following definitions — some leaning toward macro or multi-strategy hybrids — they are included here based on their classification in the NilssonHedge database. As such, they represent an important part of the systematic investing ecosystem, offering allocators broader insights into performance resilience and structural design.
Monthly Dispersion Summary: May 2025
After April’s chaotic rout, May 2025 brought a more subdued — but still challenging — dispersion profile across the systematic trend-following space. While the extremes softened, the spread of monthly performance remains wide, with continued left skew and signs of ongoing stress.
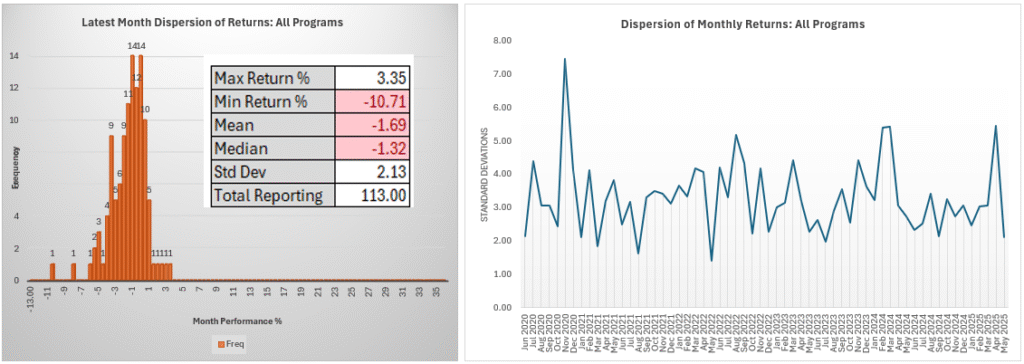
Among the 113 reporting programs, monthly returns ranged from a high of +3.35% to a low of –10.71%, reflecting a market still hostile to trend persistence.
Key statistics:
- Max Return: +3.35%
- Min Return: –10.71%
- Mean Return: –1.69%
- Median Return: –1.32%
- Standard Deviation: 2.13%
- Total Programs Reporting: 113
The histogram shows a strong concentration between –3% and 0%, with a peak in the –2.0% to –2.5% range. Most programs fell within a relatively tight band of modest losses, reflecting the lack of strong directional follow-through across asset classes.
Unlike April — where a few dramatic blow-ups pulled the entire average lower — May’s losses were more evenly distributed, suggesting that the pain was systemic rather than idiosyncratic. Still, the mean remains lower than the median, indicating a slight left skew that hints at isolated tail-risk events.
The monthly standard deviation of 2.13%, while down sharply from April’s 5.73%, is still elevated relative to historical norms — as shown in the accompanying rolling dispersion chart. The volatility of returns remains above the long-run average, affirming that regime instability and signal decay are still active headwinds.
What This Means for Allocators
- Volatility compression across the top performers suggests limited opportunity for trend amplification.
- Persistent drawdowns paired with lower dispersion may indicate systems are converging around similar unproductive signals.
- The reduction in extreme outliers provides some short-term relief — but with little sign of structural trend restoration, allocators must remain cautious.
May’s dispersion tells a quieter, but still uneasy story: systems aren’t breaking, but they’re still absorbing losses from a regime that refuses to reward trend conviction. Model resilience — particularly in how systems manage low-signal environments — remains the key differentiator.
Top 10 List: 5-Year CAGR – May 2025
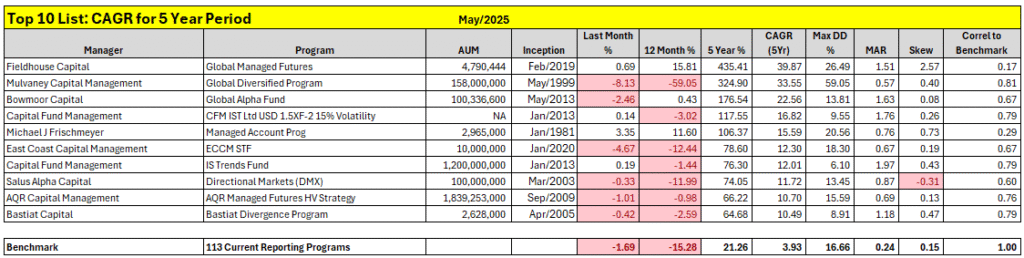
Despite the persistent turbulence of 2025, the 5-year lens continues to highlight those managers who have weathered the storm — and thrived through it. These top performers in compound annual growth rate (CAGR) over five years reflect the essence of trend following: not prediction, but compounding through process, regime shifts, and long-term structural edge.
Fieldhouse Capital now takes the top spot with an extraordinary 5-year CAGR of 39.87% and cumulative return of +435.41%. Its MAR of 1.51 and skew of +2.57 underscore not just its return potential, but its asymmetric upside exposure — an archetype of convex trend performance.
Close behind, Mulvaney Capital Management continues its long reign as a high-volatility, high-return strategy. Despite posting a –8.13% loss in May, it holds a 5-year CAGR of 35.55% and total return of +324.90%, affirming its role as the bold frontier of trend following. But its Max DD of 59.05% and MAR of 0.57 remain a reminder that such performance demands strong tolerance for risk and deep drawdowns.
Bowmoor Capital’s Global Alpha Fund remains a pillar of consistency, with a 5-year CAGR of 22.56%, Max DD of 13.81%, and a remarkable MAR of 1.63 — one of the most efficient risk-return profiles on the list.
Returning favourites:
- Capital Fund Management appears twice:
- Its CFM IST 1.5XF (15% Volatility) strategy delivered a CAGR of 16.26% with the lowest drawdown in the group (9.55%), yielding a MAR of 1.70 — near the theoretical maximum for institutional robustness.
- The IS Trends Fund follows closely with CAGR 12.01%, MAR 1.97, and a shallow drawdown of 6.10%, the best MAR ratio on the list.
- Michael J Frischmeyer’s Managed Account Program holds steady with a 15.59% CAGR and 0.76 MAR, reinforcing the enduring power of legacy models.
- East Coast Capital Management’s ECCM STF continues its upward trajectory with a 12.44% CAGR, Max DD of 13.29%, and 0.94 MAR, confirming its rising institutional credibility.
- Salus Alpha Capital’s Directional Markets (DMX) strategy enters the list with a CAGR of 10.33%, despite a tough 12-month stretch.
- AQR’s Managed Futures HV Strategy also features again, with a CAGR of 10.22% and MAR of 0.73, showing reliable long-term performance.
- Bastiat Capital’s Divergence Program rounds out the list at 10.49% CAGR, with a solid MAR of 1.18.
These 10 programs vary in volatility targeting, asset allocation, and design philosophy — but all have proven their durability. Whether through aggressive convexity or balanced efficiency, they illustrate that robust system design trumps short-term noise.
The lesson is clear: trend following’s edge plays out over years, not months. And while 2025 has been punishing, the long arc still bends toward those who stay systematic, stay diversified, and stay in the game.
Dispersion of 5-Year CAGR: Summary – May 2025
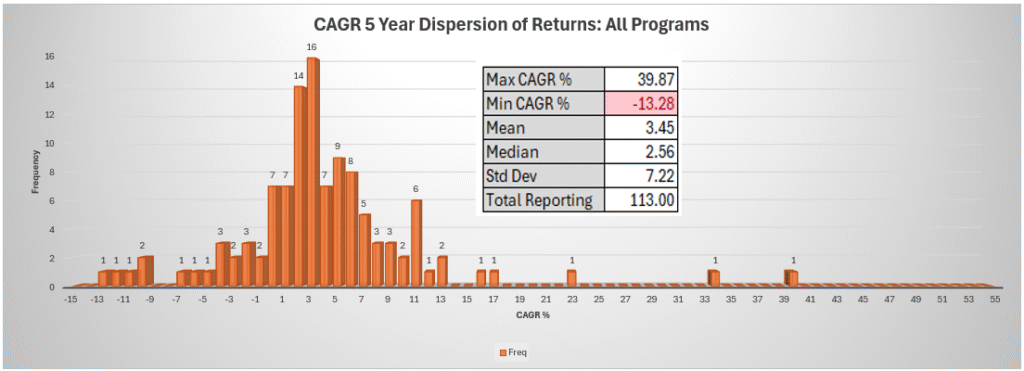
The 5-year CAGR distribution across 113 reporting programs continues to illustrate the rich diversity of design philosophies within the systematic trend-following space. While the upper tail of exceptional performers remains intact, the broader field now reveals deeper fragmentation — and an even wider spread of outcomes.
Key Metrics:
- Max CAGR: +39.87%
- Min CAGR: –13.28%
- Mean CAGR: 3.45%
- Median CAGR: 2.56%
- Standard Deviation: 7.22%
- Total Programs Reporting: 113
The distribution remains right-skewed, but with notable bulking in the 2% to 4% CAGR range, suggesting that many programs are still compounding modestly — even amid an adverse short-term regime. A clear cluster sits between 1% and 6%, signalling subdued, yet stable, structural performance.
However, this month brings two clear developments:
- The left tail has deepened. With the worst 5-year CAGR now at –13.28%, some strategies are clearly struggling to adapt to persistent volatility decay or market structure changes. The number of programs posting negative CAGR has grown slightly.
- The standard deviation rose to 7.22%, up from 5.96% in April — one of the largest month-on-month increases in dispersion over the past year. This implies increased variability not just in monthly results, but in long-term strategic durability.
Key Observations:
- Roughly three-quarters of programs remain in positive territory over five years — a strong affirmation of trend following’s structural resilience.
- Outliers like Fieldhouse (+39.87%) and Mulvaney (+35.55%) continue to stretch the upper bound, anchoring the high-convexity archetype.
- The left tail reminds us of the risks of stagnation, overfitting, and failure to recalibrate system logic in response to changing volatility regimes or shifting trend lifecycles.
- The broadening spread offers allocators a wealth of differentiation — across speed, asset selection, signal structure, and volatility targeting.
This evolving dispersion is more than a data curiosity. It reflects the true nature of a design-driven strategy class: not uniform, not static — but capable of wide-ranging outcomes, especially under pressure. For allocators, it reinforces the importance of not just choosing a “trend follower,” but understanding the DNA behind the dot.
Top 10 List: 5-Year MAR Leaders – May 2025
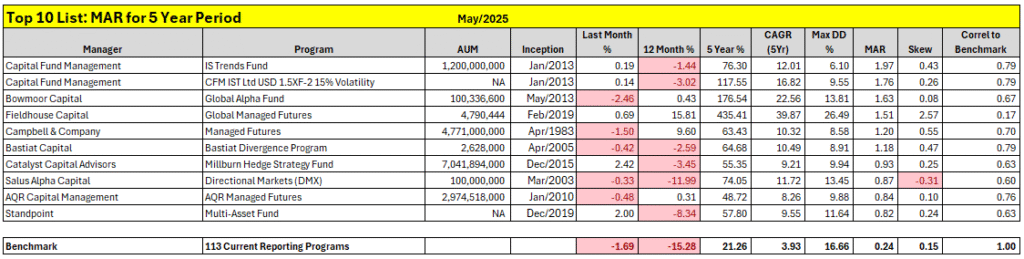
In the world of systematic trend following, CAGR may win headlines, but it’s the MAR ratio that earns trust. By evaluating the balance between return and drawdown, MAR shines a light on the most efficient and resilient strategies — those capable of compounding meaningfully without succumbing to volatility drag or structural breakdowns.
Leading the field again is Capital Fund Management’s IS Trends Fund, boasting a 5-year MAR of 1.97 — the highest in the universe. With a CAGR of 12.01% and an exceptionally shallow Max DD of just 6.10%, this strategy exemplifies what allocators seek: consistency with control.
Close behind is CFM’s other standout, the IST 1.5XF (15% Volatility) strategy, with a CAGR of 16.82%, Max DD of 9.55%, and MAR of 1.76. It reaffirms CFM’s dominance in designing volatility-aware systems that scale return without overexposing risk.
Bowmoor Capital continues to demonstrate remarkable structural balance, pairing a 22.56% CAGR with a 13.81% Max DD, yielding a MAR of 1.63. This high-growth, moderate-drawdown profile places it firmly in the sweet spot of risk-adjusted outperformance.
Other key leaders in this elite group:
- Fieldhouse Capital, with its exceptional CAGR of 39.87% and MAR of 1.51, reminds us that high-volatility strategies can still dominate over time — provided they’re convex and consistent.
- Campbell & Company again proves its institutional pedigree, posting a CAGR of 10.32%, a Max DD of just 8.58%, and a MAR of 1.20.
- Bastiat Capital’s Divergence Program delivers a balanced 10.49% CAGR with 8.91% drawdown, translating to a solid MAR of 1.18.
- Catalyst Capital’s Millburn Hedge Strategy Fund remains a staple of the mid-field with 9.21% CAGR, 9.94% DD, and MAR of 0.93.
- Salus Alpha’s DMX strategy shows how directional models can remain efficient, maintaining a MAR of 0.87 despite recent headwinds.
- AQR’s Managed Futures HV Strategy, long known for stability, posts a MAR of 0.73, highlighting its continued role as a steady allocator’s anchor.
- Standpoint’s Multi-Asset Fund rounds out the leaderboard with a respectable MAR of 0.82 — defensive, diversified, and designed to endure.
CAGR vs. Max Drawdown – Top 10 MAR Strategies
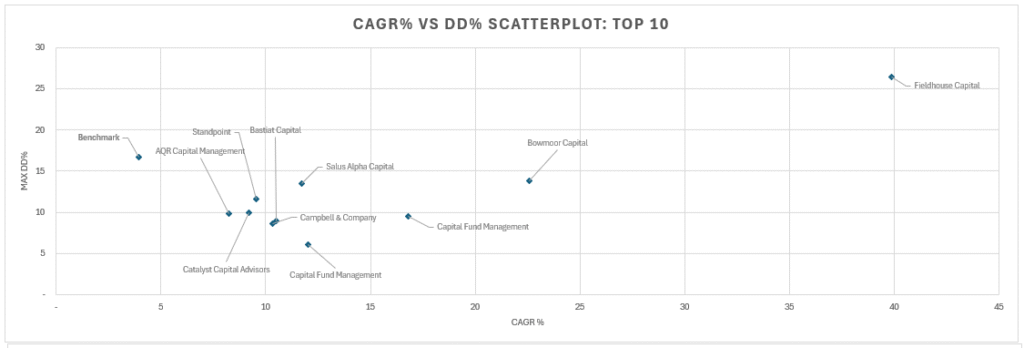
The scatterplot above offers visual clarity on how these strategies manage the trade-off between growth and risk:
- Capital Fund Management dominates the low-drawdown, high-efficiency corner, with both entries positioned deep into the efficient frontier.
- Bowmoor and Campbell form a strong middle zone, pairing respectable CAGR with constrained volatility.
- Fieldhouse, while posting the highest return, sits in the high-growth/high-drawdown quadrant, reinforcing its appeal for allocators seeking convexity over stability.
- AQR, Catalyst, and Standpoint cluster toward the conservative core, reflecting durable, lower-volatility system design.
- Bastiat and Salus Alpha hold the middle ground — diversified, balanced, and structurally sound under pressure.
This distribution underscores a timeless truth in trend following:
It’s not just how much you make — it’s how you endure while making it.
MAR remains the truest measure of robustness in a complex, regime-shifting world.
CAGR% vs Max DD% Scatterplot: All Programs – May 2025
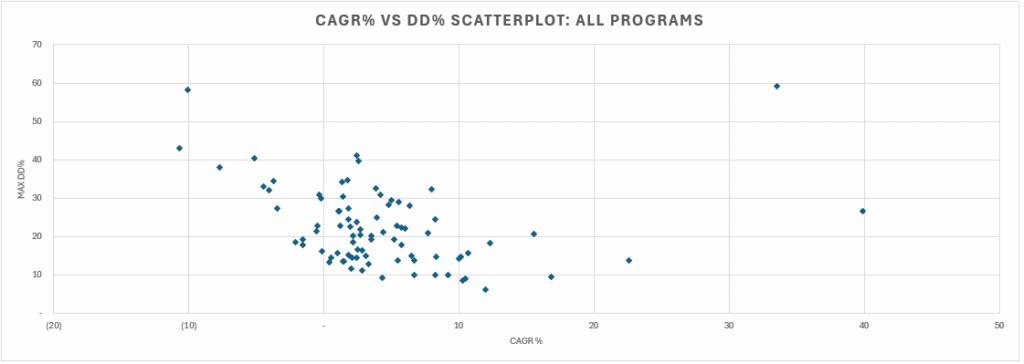
The updated full-universe scatterplot — capturing 113 systematic trend-following programs — offers a striking visual summary of performance structure over the past five years. It highlights just how diverse, asymmetric, and regime-sensitive systematic strategies can be.
Key Observations:
- Record-Setting Spread:
This month’s chart marks one of the widest spreads in recent history, with CAGR values ranging from –13.28% to +39.87%, and drawdowns stretching from below 10% to nearly 60%. The far-right outlier (Fieldhouse Capital) and far-left underperformers represent radically different philosophies — from high-convexity compounding to fragile structural breakdown. - Central Cluster Still Dominates:
Most programs sit in a CAGR range of 2%–8% with drawdowns between 15% and 30%, forming a dense structural core — the hallmark of traditional institutional-grade trend strategies balancing moderate return ambitions with prudent risk control. - High Convexity at a Price:
A small group of programs break away into high-CAGR territory (>20%), but this comes with a drawdown cost, usually north of 25%. These systems have captured exceptional upside — often by embracing greater volatility, concentrated exposures, or longer hold durations. - Red Flags on the Left:
The upper-left quadrant is populated by strategies with large drawdowns and negative CAGRs — a zone often indicative of model degradation, poor adaptation to volatility regime shifts, or aggressive leverage without adaptive controls. Allocators should approach these with caution.
What This Means for Allocators
This chart is more than a diagnostic — it’s a strategy selection compass.
- Top-right outliers can offer explosive growth, but demand risk capacity and mental resilience.
- Mid-right, low-drawdown strategies represent the gold standard for capital efficiency — ideal for long-term anchor allocations in diversified portfolios.
- The bottom cluster offers defensive return streams, often from hybrid or volatility-aware models.
- Top-left programs, on the other hand, highlight what to avoid — strategies that burn through capital while delivering little in return.
Ultimately, every point on this chart tells a story. And understanding that story — the system architecture, market exposures, volatility handling, and signal philosophy — is what separates the informed allocator from the hopeful speculator.
Conclusion – May 2025
May 2025 did not reverse the tide — but it did redefine its pace. Following April’s historic rout, the trend-following world absorbed another loss, with the benchmark falling –1.69% and dispersion remaining uncomfortably wide. While the bleeding slowed, the structural strain persists, as fleeting signals and erratic reversals continue to frustrate even the most disciplined systems.
Yet amid the noise, the long-term signal remains intact: not all strategies are built the same — and not all will survive the test of regime fragility.
At the top of the risk-adjusted leaderboard, Capital Fund Management’s IS Trends Fund reaffirmed its crown, posting a 5-year MAR of 1.97. In a world of fraying conviction, its blend of steady compounding and drawdown control stands as the clearest example of enduring capital efficiency.
Meanwhile, Fieldhouse Capital pushed the outer edge of the performance envelope, achieving a 5-year CAGR of nearly 40%. Though paired with higher drawdowns, it remains a testament to what’s possible when conviction, asymmetry, and timing align.
Other stalwarts — including Bowmoor Capital, CFM’s IST strategy, Campbell & Company, Bastiat Capital, Catalyst, AQR, and Standpoint — all demonstrated one truth in different ways: there’s no single blueprint for trend-following success. Some maximize edge through volatility targeting. Others thrive on raw convexity. And a few manage to do both, threading the needle with enviable consistency.
The universe-wide CAGR vs. Max Drawdown map remains a living x-ray of the trend-following ecosystem. With CAGRs ranging from –13.28% to +39.87%, and drawdowns from sub-10% to nearly 60%, the message is loud and clear: this is not a monolithic strategy class — it’s a spectrum of structural choices, regime adaptations, and philosophical intent.
For allocators, this month’s takeaway is especially vital: the key is not just selecting strategies — it’s understanding what they’re built to endure.
As we press further into a complex 2025, one truth stands above the turbulence: the managers featured here aren’t passengers of trend — they’re interpreters of it. They aren’t just reacting — they’re building systems that evolve, withstand, and sometimes transform how trends are harvested.
Congratulations to May’s Rising Stars and resilient Titans — and to all those pushing the boundaries of what systematic investing can achieve. In an uncertain world, they remain beacons of process, persistence, and purpose.