Battle of the Trend Following Indexes: August 2025
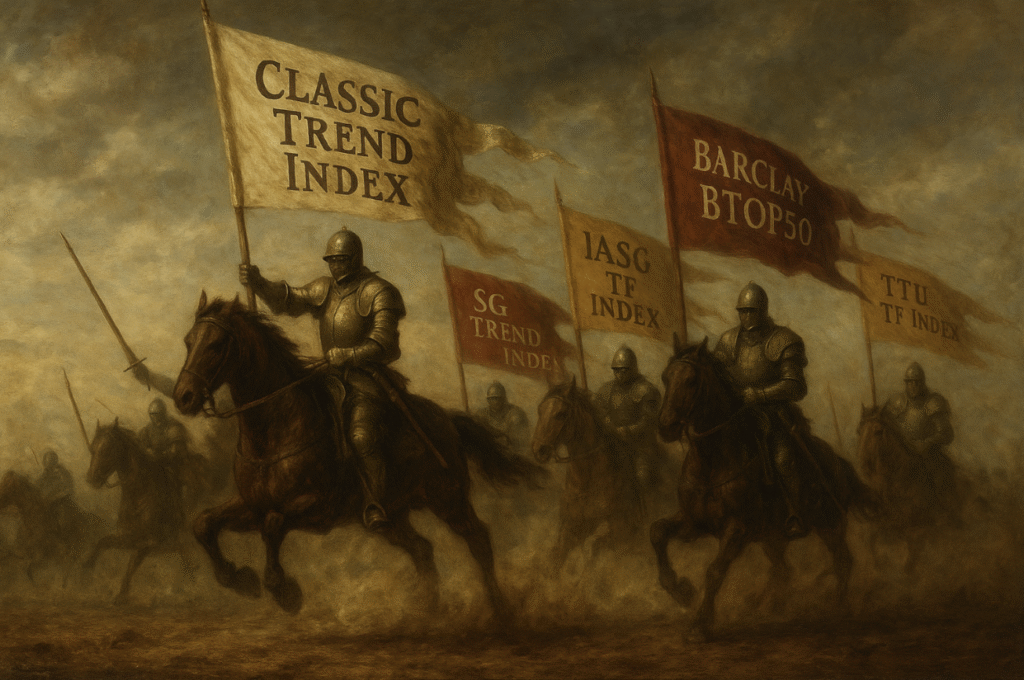
Battle of the Trend Following Indexes: August 2025 In the Battle of the Trend Following Indexes, we present a monthly update on some of the most respected trend-following benchmarks. Figures reflect performance through 31 Aug 2025, with histories rebased to 1,000 on 1 Jan 2020. August 2025 Result Broad recovery, one index still towers above. Every index closed August in the green. Classic Trend Index once again led the pack with +4.4%. IASG followed at +2.8%, SG Trend at +2.7%, TTU at +2.3%, Systematic Momentum at +2.1%, BTOP50 at +1.3%, and SG CTA at +1.2%. Behind the bounce lies a broader market context: renewed commodity momentum, shifting FX trends, and volatility in fixed income gave systematic models a wider canvas to work with. The longer arc remains clear. Classic Trend Index dominates at +110.2% since January 2020, running a 14.0% CAGR. The rest cluster tightly between +18.9% and +38.7% over the same span. YTD numbers are still negative for all, from −2.9% (BTOP50) to −9.0% (TTU). Drawdowns tell the structural story: BTOP50 anchors with the shallowest max drawdown (9.7%), while Classic compounds strongly with moderate drawdowns (14.6%) and unmatched ratios. Performance Highlights Here’s how the indexes stacked up for June: Classic Trend Index+4.4% in August, +6.7% for the quarter. YTD −4.6% yet up +110.2% since 2020 with a 14.0% CAGR. It leads every risk-adjusted measure (MAR 0.96, Sharpe 0.83, Sortino 1.91) and is tied for the most winning months at 60.3%. Importantly, Classic has shown fast drawdown recovery, bouncing back far quicker than peers when markets re-align with trend. This resilience is the engine of its compounding edge. IASG Trend Following Index+2.8% for August, +4.1% for the quarter. YTD −4.8%. Since 2020, +38.7% (5.9% CAGR) with a 15.0% max drawdown. A steady mid-pack player with a balanced profile. SG Trend Index+2.7% for August, +4.3% for the quarter. YTD −7.6%, −6.4% over 12 months. Since 2020, +34.2% with a 5.3% CAGR, but a 20.4% drawdown limits efficiency. TTU Trend Following Index+2.3% in August, +3.2% for the quarter. YTD −9.0%, 12-month −9.8%. Since 2020, +22.5% (3.6% CAGR) with a 21.2% drawdown. A broad ensemble still struggling in trend-scarce conditions. Systematic Momentum CTA Index+2.1% in August, +2.6% for the quarter. YTD −7.1%, 12-month −7.4%. Since 2020, +18.9% (3.1% CAGR) with a 16.7% drawdown. Momentum purists remain out of sync despite the month’s gain. Barclay BTOP50+1.3% in August, +1.9% for the quarter. YTD −2.9% — best of the group. Since 2020, +33.3% (5.2% CAGR). The ballast index: lowest drawdown (9.7%) and tied for most winning months at 60.3%. SG CTA Index+1.2% for August, +2.3% for the quarter. YTD −6.4%, 12-month −5.5%. Since 2020, +21.7% (3.5% CAGR) with a 16.3% drawdown. A broader CTA blend that remains muted. Performance Snapshot The VAMI chart remains simple: Classic Trend Index towers at +110.2% since 2020. All others remain tightly grouped between +18.9% and +38.7%. Dispersion narrowed in August with universal gains, but the long-term spread remains vast. Classic’s ability to recover from drawdowns faster than peers is what keeps its compounding edge intact. Where others remain underwater for extended periods, Classic claws back quickly, demonstrating the structural advantage of pure, diversified trend. Statistical Highlights Best CAGR: Classic Trend Index: 14.0% Best MAR Ratio: Classic Trend Index: 0.96 Best Sharpe / Sortino: Classic Trend Index: 0.83 / 1.91 Lowest Max Drawdown: Barclay BTOP50: 9.7% Most Winning Months: Classic Trend Index & Barclay BTOP50: 60.3% Best YTD: Barclay BTOP50: −2.9% Lowest 12-month loss: Classic Trend Index: −0.4% and BTOP50: −0.5% August Reflections August’s across-the-board green ink was a welcome shift. But the structural lessons remain unchanged: Classic proves again that compounding comes not just from catching outliers, but from recovering faster when losses hit. This rapid rebound is what turns persistence into exponential growth. BTOP50 shows why allocators lean on it as a stabilizer, with unmatched resilience. Momentum-focused and broader blends continue to show sensitivity to trend scarcity and rotation-heavy regimes. The allocator’s takeaway? A barbell approach…Classic as the compounding engine with fast recovery power, BTOP50 as the defensive anchor, captures the best of both persistence and resilience. “August showed the power of structure over signal. When all boats rise, the true differences lie in how quickly they recover from the storms.” About the Indexes SG Trend IndexCreated by Société Générale, the SG Trend Index represents the largest trend-following CTA programs, focusing on systematic strategies with significant AUM. It captures broad market movements across various assets. More on SG Trend Index Barclay BTOP50 IndexManaged by BarclayHedge, this index follows the largest investable CTAs, emphasizing diversification across major futures markets. It’s a widely referenced benchmark for managed futures. More on BTOP50 Index TTU Trend Following IndexDeveloped by Top Traders Unplugged, the TTU TF Index includes programs with a 15-year track record, emphasizing resilience through experience and diversification across a large ensemble of programs. More on TTU TF Index SG CTA IndexAnother index by Société Générale, the SG CTA Index covers a broader array of CTA strategies, providing insight into the managed futures landscape beyond trend following alone. More on SG CTA Index IASG Trend Following IndexThis index, managed by IASG, tracks CTAs that primarily use trend-following strategies, offering a focused benchmark within the managed futures space. More on IASG TF Index Classic Trend IndexThe Classic Trend Index, curated by the Aussie Turtles, is a benchmark for traditional trend-following strategies, focusing on consistent, systematic approaches across diversified asset classes. More on Classic Trend Index Systematic Momentum CTA IndexManaged by NilssonHedge, this index tracks CTAs focused on momentum-based strategies, providing a purist view of momentum trading within managed futures. More on Systematic Momentum CTA Index Stay tuned for next month’s Battle of the Trend Following Indexes to see which benchmarks emerge as the top performers in the trend-following landscape.
Battle of the Trend Following Indexes: July 2025
Battle of the Trend Following Indexes: July 2025 In the Battle of the Trend Following Indexes, we present a monthly update on some of the most respected trend-following benchmarks. July 2025 Result Marginal gains, modest losses, and one index still standing apart. July delivered a mixed set of outcomes. Four of the seven indexes managed to scrape into positive territory, though gains were only marginal. Classic Trend Index led with a +0.3% return, while SG CTA and IASG each added +0.2%, and SG Trend was flat. On the downside, TTU slipped −0.4%, BTOP50 dropped −0.8%, and Systematic Momentum finished flat-to-negative at 0.0%. The real story remains the long arc. Classic Trend Index has now more than doubled since January 2020 (+101.3%), running a 13.3% CAGR and leading every risk-adjusted measure. The rest of the field remains tightly clustered between +16% and +36% over the same span. YTD numbers stay firmly negative across the board, from −4.0% for BTOP50 to around −10% for SG Trend and TTU. The drawdown profile is equally telling: Classic has absorbed a 14.6% max drawdown but still compounds well above the pack, while BTOP50 has kept its drawdown to just 9.7%, proving why it continues to be viewed as the defensive benchmark. Performance Highlights Here’s how the indexes stacked up for June: Classic Trend IndexManaged a small gain of +0.3% in July, only marginally ahead of its peers. The long-term record is where it shines: +101.3% since 2020 with a 13.3% CAGR. It leads every risk-adjusted measure (Sharpe 0.79, Sortino 1.94, MAR 0.91). Even when monthly wins are slim, its structure shows why pure trend persistence compounds over time. SG CTA IndexClosed July with a narrow +0.2% gain, trimming some of its YTD decline (−7.5%). Longer term it sits at +20.2% since 2020, but middling ratios and a 16.3% drawdown highlight its vulnerability in rotation-heavy regimes. IASG Trend Following IndexAlso up +0.2%. Its −6.8% YTD remains challenging, but the longer record is steadier: +35.0% since 2020, 5.5% CAGR, and relatively moderate drawdowns at 14.8%. SG Trend IndexFlat at 0.0% for July, leaving it −10.0% YTD and −13.0% over 12 months. It has gained +30.6% since 2020 but carries the highest drawdown in the group (20.4%), keeping risk efficiency muted. TTU Trend Following IndexDropped −0.4% in July. With YTD at −10.4% and a 12-month return of −14.9%, the broader program basket continues to struggle in low-trend conditions. Since 2020 it has returned +20.4% with a 3.2% CAGR. Barclay BTOP50Down −0.8% in July, but still the best positioned YTD at −4.0%. Its strength is resilience: the lowest drawdown (9.7%) and the highest win rate (59.7%), underlining its role as the ballast index. Systematic Momentum CTA IndexFinished the month flat at 0.0%. It remains down −8.9% YTD and −12.1% over 12 months. While cumulative return since 2020 is +16.6%, its Sharpe ratio (0.05) and lowest win rate (49.3%) confirm that momentum strategies remain out of phase. Performance Snapshot The VAMI chart continues to tell a simple story: Classic Trend Index stands alone. Its cumulative +101.3% since 2020 puts it far ahead of the +16% to +36% range occupied by the other six benchmarks. Beneath the leader, dispersion is narrow. The diversified indexes remain clustered together, with long-run gains erased by significant drawdowns. Within that pack, BTOP50 distinguishes itself with remarkable consistency: lowest drawdown, highest win rate, and the shallowest YTD decline. July’s small gains and losses did little to change the bigger picture — one index dominates by structure, the others rotate between resilience and retreat. Statistical Highlights Best CAGR: Classic Trend Index – 13.3% Best MAR Ratio: Classic Trend Index – 0.91 Best Sharpe / Sortino: Classic Trend Index – 0.79 / 1.94 Lowest Max Drawdown: Barclay BTOP50 – 9.7% Most Winning Months: Classic Trend Index & Barclay BTOP50 – 59.7% July Reflections July was about dispersion rather than recovery. A handful of indexes managed marginal gains, but all remain negative for the year. Classic Trend Index’s edge is not about winning every month — it’s about compounding relentlessly over time. For allocators, BTOP50’s steadiness once again proved its value as a defensive anchor, while broader blends like TTU struggled with trend scarcity. Momentum systems remain out of sync, reinforcing the need for robustness when reversals dominate. “Conviction does not need to shout. Process that survives is process that compounds.” About the Indexes SG Trend IndexCreated by Société Générale, the SG Trend Index represents the largest trend-following CTA programs, focusing on systematic strategies with significant AUM. It captures broad market movements across various assets. More on SG Trend Index Barclay BTOP50 IndexManaged by BarclayHedge, this index follows the largest investable CTAs, emphasizing diversification across major futures markets. It’s a widely referenced benchmark for managed futures. More on BTOP50 Index TTU Trend Following IndexDeveloped by Top Traders Unplugged, the TTU TF Index includes programs with a 15-year track record, emphasizing resilience through experience and diversification across a large ensemble of programs. More on TTU TF Index SG CTA IndexAnother index by Société Générale, the SG CTA Index covers a broader array of CTA strategies, providing insight into the managed futures landscape beyond trend following alone. More on SG CTA Index IASG Trend Following IndexThis index, managed by IASG, tracks CTAs that primarily use trend-following strategies, offering a focused benchmark within the managed futures space. More on IASG TF Index Classic Trend IndexThe Classic Trend Index, curated by the Aussie Turtles, is a benchmark for traditional trend-following strategies, focusing on consistent, systematic approaches across diversified asset classes. More on Classic Trend Index Systematic Momentum CTA IndexManaged by NilssonHedge, this index tracks CTAs focused on momentum-based strategies, providing a purist view of momentum trading within managed futures. More on Systematic Momentum CTA Index Stay tuned for next month’s Battle of the Trend Following Indexes to see which benchmarks emerge as the top performers in the trend-following landscape.
Battle of the Trend Following Indexes: June 2025
Battle of the Trend Following Indexes: June 2025 In the Battle of the Trend Following Indexes, we present a monthly update on some of the most respected trend-following benchmarks. June 2025 Result All in the black. One led with conviction. June delivered a broad-based recovery for trend followers, with every tracked index posting a positive return. After a bruising Q2, this rebound offered a welcome shift — though not yet a trend reversal. Topping the leaderboard was the Classic Trend Index, gaining +1.9% for the month. It continues to dominate on long-term metrics, with a 13.5% CAGR, 100.7% total return since Jan 2020, and best-in-class ratios across Sharpe (0.79), Sortino (1.93), and MAR (0.92). In a year marked by false starts, it remains the benchmark for trend purity and persistence. The Barclay BTOP50 Index also rose +1.5%, extending its reputation as the most resilient of the diversified indexes. With a modest -3.5% YTD drawdown, the lowest max drawdown (9.9%), and the highest winning month frequency (60.6%), it continues to offer stability when conditions turn volatile. While June’s bounce helped ease portfolio pressure, six of the seven indexes remain down more than 7% year-to-date, reflecting how difficult the trend environment has been in 2025 — even for seasoned systems. Performance Highlights Here’s how the indexes stacked up for June: Classic Trend Index:June’s top performer, up +1.9%, reaffirming its position as the long-term standout. With a 100.7% total return since Jan 2020, a 13.5% CAGR, and leading stats in Sharpe (0.79), Sortino (1.93), and MAR ratio (0.92), it continues to show what pure trend following can deliver over time — even when short-term conditions are tough. Barclay BTOP50:Also posted a solid +1.5%, cushioning its YTD decline to just -3.5%. With the lowest max drawdown (9.9%) and the highest win rate (60.6%), BTOP50 remains the defensive stalwart among diversified CTA benchmarks. SG Trend Index:Matched BTOP50 with a +1.5% gain, but still sits -10.0% YTD, with the highest drawdown (20.4%) in the group. While its 5.0% CAGR offers a respectable long-term return, risk-adjusted metrics like Sharpe (0.25) and MAR (0.24) remain subdued. IASG Trend Following Index:Added +1.3% in June, improving its positioning somewhat, but still off -7.1% YTD. Long-term stats remain respectable with a 5.5% CAGR, a solid Sortino (0.37), and lower drawdowns than most. TTU Trend Following Index:Up +1.0%, but continues to struggle in 2025 with a -10.5% YTD return and a -17.2% 12-month decline. Broader program inclusion hasn’t helped in this trend-starved environment, with Sharpe (0.12) and MAR (0.17) near the bottom of the table. SG CTA Index:Gained +0.9%, but its -7.7% YTD performance and 16.3% drawdown underscore the difficulty faced by diversified CTA strategies. Its Sharpe (0.12) and Sortino (0.13) remain among the lowest of the group. Systematic Momentum CTA Index:Also rose +0.9%, but continues to underperform with the lowest Sharpe (0.06) and tied-lowest MAR ratio (0.17). Momentum systems remain out of phase with current market conditions, sitting -8.7% YTD and -13.7% over the past 12 months. Performance Snapshot The Classic Trend Index remains firmly in front on the VAMI chart, extending its lead with a strong June. Despite short-term drawdown pressure, its cumulative return since January 2020 has now crossed +100%, maintaining a performance gap that no other index has come close to closing. Beneath the leader, the other six indexes continue to cluster tightly. Most show modest long-term gains with significant drawdown volatility. Within this group, the Barclay BTOP50 Index stands apart for its remarkable consistency, holding both the lowest drawdown and the highest win rate, reinforcing its role as the portfolio ballast in uncertain waters. While June’s rebound lifted all boats, the long-run spread between trend purity and diversified blends remains evident in the chart. Statistical Table June’s data continues to affirm the long-term standouts: Best CAGR: Classic Trend Index – 13.5% Best MAR Ratio: Classic Trend Index – 0.92 Best Sharpe / Sortino: Classic Trend Index – 0.79 / 1.93 Lowest Max Drawdown: Barclay BTOP50 – 9.9% Most Winning Months: Barclay BTOP50 – 60.6% While all indexes posted positive returns this month, the broader picture remains divided. Most continue to deliver moderate to low risk-adjusted returns, with drawdowns and underwhelming Sharpe ratios pointing to a tough YTD environment for trend programs. June Reflections June delivered relief, but not reversal. For systematic trend followers, the month offered a rare alignment — a reprieve from Q2’s trendless churn and a glimpse of what conviction might look like again. The Classic Trend Index led the way, not by luck, but by structure. It reminded us that edge lies in consistency over novelty, and that staying true to process through the noise is what ultimately separates signal from static. The Barclay BTOP50, once again, proved that robustness is a strategy, not just a feature. In a year where sharp reversals have punished overcommitment, its ability to absorb shocks while steadily compounding speaks volumes. June may not have resolved the drawdown narrative, but it reminded us of an enduring truth in trend: “Conviction doesn’t need to be loud — just consistent enough to survive the storm.” About the Indexes SG Trend IndexCreated by Société Générale, the SG Trend Index represents the largest trend-following CTA programs, focusing on systematic strategies with significant AUM. It captures broad market movements across various assets. More on SG Trend Index Barclay BTOP50 IndexManaged by BarclayHedge, this index follows the largest investable CTAs, emphasizing diversification across major futures markets. It’s a widely referenced benchmark for managed futures. More on BTOP50 Index TTU Trend Following IndexDeveloped by Top Traders Unplugged, the TTU TF Index includes programs with a 15-year track record, emphasizing resilience through experience and diversification across a large ensemble of programs. More on TTU TF Index SG CTA IndexAnother index by Société Générale, the SG CTA Index covers a broader array of CTA strategies, providing insight into the managed futures landscape beyond trend following alone. More on SG CTA Index IASG Trend Following IndexThis index, managed by IASG, tracks CTAs that primarily use trend-following strategies, offering a
Battle of the Trend Following Indexes: May 2025

Battle of the Trend Following Indexes: May 2025 In the Battle of the Trend Following Indexes, we present a monthly update on some of the most respected trend-following benchmarks. May 2025 Result Six in the red. One in the green. May was another tough month for trend followers — but this time, one benchmark stood tall. While six of the seven tracked indexes posted losses, the Classic Trend Index managed to finish the month up +0.1%, proving once again that trend purity can sometimes stand firm, even in chaotic seas. The rest of the field continued to struggle. Though May’s losses were shallower than April’s, the Q2 trend vacuum remains unforgiving. Systems built to ride waves are still waiting for clean breaks. Once again, Barclay BTOP50 offered the most defensive profile, with a mild -1.4% drop and continued leadership in drawdown control and monthly win rate. Performance Highlights Here’s how the indexes stacked up for May: Classic Trend Index: The only index in positive territory, gaining +0.1% in May. Despite a bruising Q2, it remains the undisputed long-term champion: +97.0% since Jan 2020, 13.3% CAGR, and top marks in Sharpe (0.78), Sortino (1.94), and MAR ratio (0.91). Trend following in its purest form — and still the most potent. Barclay BTOP50: Down just -1.4%, it continues to deliver consistency with only -4.5% YTD, the lowest max drawdown (9.5%), and the highest win rate (60.0%). A clear outlier in resilience. TTU Trend Following Index: Fell -2.7%, now -11.3% YTD. The broad multi-program composition hasn’t shielded it from trendlessness. SG Trend Index: Dropped -2.2%, matching TTU’s YTD decline of -11.3%. With a 20.4% drawdown and muted MAR (0.23), it continues to struggle with risk-adjusted efficiency. SG CTA Index: Lost -1.8%, sitting at -8.5% YTD. Broader than trend-only strategies, but lacking any real upside in this regime. IASG Trend Following Index: Down -1.5% in May and -8.1% YTD. Solid long-term CAGR of 5.4% and good Sortino (0.37), but recent returns have softened. Systematic Momentum CTA Index: Declined -1.8% in May and -9.3% YTD. Pure momentum remains out of sync with current market dynamics. Performance Snapshot The VAMI chart still crowns the Classic Trend Index. After its sharp April drawdown, its May resilience helped it stabilize and retain its commanding lead. Its cumulative performance remains nearly double that of its peers. The remaining six indexes continue to show clustered performance, emphasizing defensiveness over directional aggression. Among them, Barclay BTOP50 is the clear defensive outperformer. Statistical Table May’s updated data further reinforces these highlights: Best CAGR: Classic Trend Index – 13.3% Best MAR Ratio: Classic Trend Index – 0.91 Best Sharpe / Sortino: Classic Trend Index – 0.78 / 1.94 Lowest Max DD: Barclay BTOP50 – 9.5% Most Winning Months: Barclay BTOP50 – 60.0% The rest of the field posts moderate to low risk-adjusted returns, with no clear breakout performance YTD. May Reflections May didn’t offer full recovery — but it did give us a signal. Systematic trend models, especially those grounded in traditional price-based logic, can still shine through when noise subsides, even briefly. The Classic Trend Index proved that edge isn’t always about magnitude — it’s about persistence. A +0.1% return in a sea of red is a small but important victory. Meanwhile, the Barclay BTOP50 continues to provide ballast, showing why robustness matters when conviction is punished. “When everyone else is sinking slowly, even treading water is leadership.” About the Indexes SG Trend IndexCreated by Société Générale, the SG Trend Index represents the largest trend-following CTA programs, focusing on systematic strategies with significant AUM. It captures broad market movements across various assets. More on SG Trend Index Barclay BTOP50 IndexManaged by BarclayHedge, this index follows the largest investable CTAs, emphasizing diversification across major futures markets. It’s a widely referenced benchmark for managed futures. More on BTOP50 Index TTU Trend Following IndexDeveloped by Top Traders Unplugged, the TTU TF Index includes programs with a 15-year track record, emphasizing resilience through experience and diversification across a large ensemble of programs. More on TTU TF Index SG CTA IndexAnother index by Société Générale, the SG CTA Index covers a broader array of CTA strategies, providing insight into the managed futures landscape beyond trend following alone. More on SG CTA Index IASG Trend Following IndexThis index, managed by IASG, tracks CTAs that primarily use trend-following strategies, offering a focused benchmark within the managed futures space. More on IASG TF Index Classic Trend IndexThe Classic Trend Index, curated by the Aussie Turtles, is a benchmark for traditional trend-following strategies, focusing on consistent, systematic approaches across diversified asset classes. More on Classic Trend Index Systematic Momentum CTA IndexManaged by NilssonHedge, this index tracks CTAs focused on momentum-based strategies, providing a purist view of momentum trading within managed futures. More on Systematic Momentum CTA Index Stay tuned for next month’s Battle of the Trend Following Indexes to see which benchmarks emerge as the top performers in the trend-following landscape.
Battle of the Trend Following Indexes: April 2025
Battle of the Trend Following Indexes: April 2025 In the Battle of the Trend Following Indexes, we present a monthly update on some of the most respected trend-following benchmarks. April 2025 Result April was a bruiser. The trend-following battlefield offered no shelter this month, as losses hit across the board. After the setbacks of Q1, April brought more pain — with all seven tracked indexes ending the month in the red. The volatility was real, but directional conviction remained elusive. For models primed to ride waves, April gave only chop. Once again, the Classic Trend Index took the biggest hit — down -7.0% for the month and now -10.6% YTD — but it still towers over the field in long-term performance. Its CAGR of 13.5% and stellar MAR ratio of 0.93 are unmatched, a testament to trend purity and process integrity. Performance Highlights April compounded the losses from Q1, dragging every major trend benchmark into deeper YTD territory. While the Barclay BTOP50 Index again proved most defensive with a -3.3% decline, even it couldn’t escape unscathed. Here’s how each index fared in April: Classic Trend Index: Fell -7.0% in April and is now down -10.6% YTD. Despite the pain, it remains the undisputed long-term leader with a CAGR of 13.5%, Sharpe ratio of 0.79, Sortino of 1.94, and a total return of 96.8% since Jan 2020. Its MAR of 0.93 reflects exceptional resilience through the cycle. SG Trend Index: Dropped -4.9% in April and -9.3% YTD. Over the last 12 months, it’s down -18.6%. While its CAGR of 5.3% is respectable, a max drawdown of 18.6% weighs heavily on its MAR ratio (0.28). Barclay BTOP50: The best relative performer again in April, down -3.3% for the month. It leads YTD with a comparatively shallow -3.1% decline and has the lowest drawdown (8.7%) across all benchmarks. Its long-term CAGR of 5.5% and Sharpe of 0.38 affirm its defensive profile. TTU Trend Following Index: Suffered a -6.5% loss in April, extending its YTD decline to -9.7%. Its CAGR of 3.8% and drawdown of 19.0% leave it struggling in risk-adjusted terms (MAR ratio: 0.20), though its diversified multi-manager nature still offers signal diversity. SG CTA Index: Down -4.4% in April and -6.9% YTD. A lower-volatility player with a 3.6% CAGR and 14.8% max drawdown, its MAR ratio sits at 0.25, reflecting middling efficiency in recent years. IASG Trend Following Index: Declined -4.6% in April, bringing YTD losses to -7.1%. It maintains a solid long-term CAGR of 5.6% with a relatively balanced Sharpe of 0.33, though it too has been hit hard in the last 12 months (-14.3%). Systematic Momentum CTA Index: Fell -4.4% in April, now down -7.0% YTD and -14.5% over the last 12 months. Its 3.3% CAGR and 14.5% max drawdown give it a MAR ratio of 0.23 — a tough period for pure momentum systems. Performance Snapshot The VAMI chart continues to tell a clear story. Despite the recent decline, the Classic Trend Index retains its dominant long-term position — nearly doubling since January 2020. The remaining benchmarks remain tightly packed, reflecting similar performance profiles over time. The April data reinforce a familiar truth: while defensive indexes like Barclay BTOP50 may hold ground in choppy conditions, they don’t capture the same upside in trending environments. Classic Trend’s volatility may sting, but its edge over time remains unmistakable. Statistical Table The table reveals clustering among most indexes, both in terms of long-term CAGR (3.3% to 5.6%) and drawdown profiles. However, Classic Trend breaks this mold: Best CAGR: Classic Trend Index – 13.5% Best Sharpe/Sortino: Classic Trend Index – 0.79 / 1.94 Best MAR Ratio: Classic Trend Index – 0.93 Best Drawdown Profile: Barclay BTOP50 – 8.7% Most Winning Months: Barclay BTOP50 – 60.9% While April was painful across the board, the dispersion in quality is clear when you look beyond the month-to-month chop. The signal is in the stats. April Reflections April tested every model’s ability to endure, adapt, and stay the course. No index was spared. And yet, even in this red sea, the message is consistent: edge is long-term. The Classic Trend Index, built on traditional trend principles and unrelenting systematic discipline, may have taken a blow, but it remains structurally sound — with the strongest return profile and best risk-adjusted performance of the group. “It’s not the smoothest ride that wins. It’s the one still standing at the end of the storm.” About the Indexes SG Trend IndexCreated by Société Générale, the SG Trend Index represents the largest trend-following CTA programs, focusing on systematic strategies with significant AUM. It captures broad market movements across various assets. More on SG Trend Index Barclay BTOP50 IndexManaged by BarclayHedge, this index follows the largest investable CTAs, emphasizing diversification across major futures markets. It’s a widely referenced benchmark for managed futures. More on BTOP50 Index TTU Trend Following IndexDeveloped by Top Traders Unplugged, the TTU TF Index includes programs with a 15-year track record, emphasizing resilience through experience and diversification across a large ensemble of programs. More on TTU TF Index SG CTA IndexAnother index by Société Générale, the SG CTA Index covers a broader array of CTA strategies, providing insight into the managed futures landscape beyond trend following alone. More on SG CTA Index IASG Trend Following IndexThis index, managed by IASG, tracks CTAs that primarily use trend-following strategies, offering a focused benchmark within the managed futures space. More on IASG TF Index Classic Trend IndexThe Classic Trend Index, curated by the Aussie Turtles, is a benchmark for traditional trend-following strategies, focusing on consistent, systematic approaches across diversified asset classes. More on Classic Trend Index Systematic Momentum CTA IndexManaged by NilssonHedge, this index tracks CTAs focused on momentum-based strategies, providing a purist view of momentum trading within managed futures. More on Systematic Momentum CTA Index Stay tuned for next month’s Battle of the Trend Following Indexes to see which benchmarks emerge as the top performers in the trend-following landscape.
Battle of the Trend Following Indexes: March 2025
Battle of the Trend Following Indexes: March 2025 In the Battle of the Trend Following Indexes, we present a monthly update on some of the most respected trend-following benchmarks. March 2025 Result March was a bruising continuation of February’s retreat, as whipsawing markets and vanishing trends battered trend-following models across the board. The great battlefields of systematic investing offered no refuge this month—volatility persisted, and directional conviction was absent. Once again, the Classic Trend Index held the high ground despite taking a -2.5% hit in March. Even with the losses, its towering CAGR of 15.3% and MAR ratio of 1.75 keep it firmly entrenched as the benchmark for capturing outlier moves with disciplined trend adherence. Performance Highlights March continued the challenging stretch for trend followers, with six of the seven major indexes finishing in the red. Only the Barclay BTOP50 posted a gain, confirming its status as the most defensive and stable of the group. Meanwhile, the Classic Trend Index, despite a -2.5% decline, continues to dominate the long-term landscape, with a return profile that sets it well apart from the field. Here’s how each index performed in March: Classic Trend Index: Dropped -2.5% in March and -5.1% YTD, yet remains the undisputed long-term leader with a CAGR of 15.3%, Sharpe ratio of 0.96, Sortino of 2.51, and 111.6% total return since Jan 2020. Its drawdown remains moderate at 8.8%, further strengthening its exceptional MAR ratio of 1.75. SG Trend Index: Fell -1.7% in March and is now down -4.7% YTD, with a 12-month return of -12.9%. Its CAGR of 6.4% is solid, but a 14.4% max drawdown continues to suppress its MAR ratio (0.44). Barclay BTOP50: The only index to finish March positive at +0.7%, also leading YTD with +0.3%. Its drawdown is the lowest of all (8.7%), and it boasts the highest percentage of winning months (61.9%), reinforcing its reputation as the most conservative trend-following benchmark. TTU Trend Following Index: Dropped -1.7% in March and is now -3.4% YTD, with a CAGR of 5.2% and Sharpe of 0.29. Its 13.2% max drawdown limits its risk-adjusted appeal, though its broad composition provides useful signal diversity. SG CTA Index: Held up reasonably well, declining just -0.6% for the month and -2.5% YTD, with a CAGR of 4.6% and drawdown of 11.3%. A lower-volatility performer, but lacking upside over the long haul. IASG TF Index: Also fell -1.7%, bringing YTD losses to -2.8%. Its CAGR of 6.6% and Sharpe of 0.43 reflect balanced, steady returns, albeit with a moderate 10.4% drawdown. Systematic Momentum CTA Index: Declined -1.3%, continuing a tough stretch with -2.8% YTD and -9.1% over 12 months. With a CAGR of 4.2% and relatively modest risk metrics, it remains a key proxy for pure momentum systems, but has struggled recently to keep pace. Performance Snapshot The VAMI chart still tells a compelling story of Classic Trend Index dominance, now boasting a total return of 111.6% since January 2020—comfortably ahead of the pack. While March added to February’s stumble, the Classic Trend Index remains the clear trend titan, standing tall above its more defensive and clustered peers. Statistical Table March’s results highlight a key feature of the current trend-following landscape: most indexes remain tightly clustered, showing little dispersion in long-term performance or risk metrics. Their similar trajectories reflect a common struggle with recent market indecision. But one index continues to stand apart—the Classic Trend Index. With a CAGR above 15%, a Sharpe ratio over 1, and a Sortino exceeding 2.5, its performance clearly diverges from the pack. This dispersion is clearly reflected in the VAMI chart above, where Classic Trend separates from the cluster and continues its long climb. In an environment where most strategies move in lockstep, Classic Trend proves that true differentiation still exists. March Reflections March extended the headwinds for trend followers, reinforcing the lesson from February: when markets lack directional persistence, trend strategies suffer. The month brought more chop than conviction, testing the adaptability and patience of systematic models. Yet through the fog, one signal remains clear — the Classic Trend Index continues to exemplify the strength of traditional, process-driven approaches. While not immune to drawdowns, its long-term outperformance stands as a testament to consistency, diversification, and staying the course through uncertainty. “Classic Trend continues to prove that not all trend-following is created equal.” About the Indexes SG Trend IndexCreated by Société Générale, the SG Trend Index represents the largest trend-following CTA programs, focusing on systematic strategies with significant AUM. It captures broad market movements across various assets. More on SG Trend Index Barclay BTOP50 IndexManaged by BarclayHedge, this index follows the largest investable CTAs, emphasizing diversification across major futures markets. It’s a widely referenced benchmark for managed futures. More on BTOP50 Index TTU Trend Following IndexDeveloped by Top Traders Unplugged, the TTU TF Index includes programs with a 15-year track record, emphasizing resilience through experience and diversification across a large ensemble of programs. More on TTU TF Index SG CTA IndexAnother index by Société Générale, the SG CTA Index covers a broader array of CTA strategies, providing insight into the managed futures landscape beyond trend following alone. More on SG CTA Index IASG Trend Following IndexThis index, managed by IASG, tracks CTAs that primarily use trend-following strategies, offering a focused benchmark within the managed futures space. More on IASG TF Index Classic Trend IndexThe Classic Trend Index, curated by the Aussie Turtles, is a benchmark for traditional trend-following strategies, focusing on consistent, systematic approaches across diversified asset classes. More on Classic Trend Index Systematic Momentum CTA IndexManaged by NilssonHedge, this index tracks CTAs focused on momentum-based strategies, providing a purist view of momentum trading within managed futures. More on Systematic Momentum CTA Index Stay tuned for next month’s Battle of the Trend Following Indexes to see which benchmarks emerge as the top performers in the trend-following landscape.
Battle of the Trend Following Indexes: February 2025
Battle of the Trend Following Indexes: February 2025 In the Battle of the Trend Following Indexes, we present a monthly update on some of the most respected trend-following benchmarks. February 2025 Result The clash of titans in February saw a broad retreat across the trend-following landscape. After a strong showing in prior months, February proved turbulent, with all indexes reporting negative returns. The Classic Trend Index, while still the long-term leader, faced its toughest month in a while, highlighting just how quickly tides can turn in systematic strategies. Performance Highlights February delivered a firm reminder that trend following isn’t immune to drawdowns. All indexes posted losses for the month, with the Classic Trend Index down -3.8%, its sharpest monthly drop in recent memory. The TTU Trend Following Index and SG Trend Index also struggled, each shedding over 3%. Here’s how each index performed in February: Classic Trend Index: Fell by -3.8%, but still stands tall over the long term with a CAGR of 16.3%, a Sharpe of 1.04, and a towering Sortino of 2.58. It remains the gold standard in capturing outlier trends with discipline. SG Trend Index: Dropped -3.2%, bringing its YTD return to -3.0% and its 12-month return to -7.7%. Despite a CAGR of 6.8%, the drawdown of 14.4% weighs on its risk metrics. Barclay BTOP50: Declined just -1.3%, proving once again to be the most conservative option with the lowest maximum drawdown of 8.7% and a MAR ratio of 0.73. TTU Trend Following Index: Lost -3.3% in February and sits at 5.7% CAGR since 2020, with metrics showing steady yet less aggressive positioning. IASG TF Index: Down -2.7% on the month, but continues to show respectable consistency, holding a CAGR of 7.0% and a Sharpe ratio of 0.47. SG CTA Index: Also fell -2.5%, with weaker long-term stats—4.8% CAGR and 11.3% max drawdown. Systematic Momentum CTA Index: Matched SG CTA with a -2.5% decline. While its 12-month return of -4.6% lags, it remains a valuable benchmark for pure momentum strategies. Performance Snapshot The VAMI chart continues to paint a powerful picture of Classic Trend Index dominance, reaching 118.5% total return since January 2020, well ahead of its peers. Even after February’s stumble, it remains the clear trend titan. Statistical Table The performance table below underscores the dispersion across strategies. While short-term pain was felt across the board in February, long-term resilience remains the hallmark of top-performing indexes like the Classic Trend Index. February Reflections While February was a rough month for trend followers, it served as a timely reminder: trend strategies thrive on price persistence—not chop. The current environment appears to be testing models that rely on sustained directional moves. Despite the setback, the Classic Trend Index continues to demonstrate the power of traditional, process-driven approaches, highlighting the value of staying the course in uncertain times. About the Indexes SG Trend IndexCreated by Société Générale, the SG Trend Index represents the largest trend-following CTA programs, focusing on systematic strategies with significant AUM. It captures broad market movements across various assets. More on SG Trend Index Barclay BTOP50 IndexManaged by BarclayHedge, this index follows the largest investable CTAs, emphasizing diversification across major futures markets. It’s a widely referenced benchmark for managed futures. More on BTOP50 Index TTU Trend Following IndexDeveloped by Top Traders Unplugged, the TTU TF Index includes programs with a 15-year track record, emphasizing resilience through experience and diversification across a large ensemble of programs. More on TTU TF Index SG CTA IndexAnother index by Société Générale, the SG CTA Index covers a broader array of CTA strategies, providing insight into the managed futures landscape beyond trend following alone. More on SG CTA Index IASG Trend Following IndexThis index, managed by IASG, tracks CTAs that primarily use trend-following strategies, offering a focused benchmark within the managed futures space. More on IASG TF Index Classic Trend IndexThe Classic Trend Index, curated by the Aussie Turtles, is a benchmark for traditional trend-following strategies, focusing on consistent, systematic approaches across diversified asset classes. More on Classic Trend Index Systematic Momentum CTA IndexManaged by NilssonHedge, this index tracks CTAs focused on momentum-based strategies, providing a purist view of momentum trading within managed futures. More on Systematic Momentum CTA Index Stay tuned for next month’s Battle of the Trend Following Indexes to see which benchmarks emerge as the top performers in the trend-following landscape.
Battle of the Trend Following Indexes: January 2025

Battle of the Trend Following Indexes: January 2025 In the Battle of the Trend Following Indexes, we present a monthly update on some of the most respected trend-following benchmarks. January 2025 Result January ushered in a strong start for several trend-following indexes, with the Classic Trend Index once again demonstrating its superiority. Market conditions remained dynamic, testing the adaptability of systematic trend strategies across various asset classes. Performance Highlights January 2025 delivered varied results across trend-following indexes, with some continuing their strong momentum while others lagged. Market conditions remained dynamic, testing the resilience of different strategies. Here’s how each index performed: Classic Trend Index – The standout performer for the month, gaining 3.7% in January. Over the last 12 months, it returned 19.2%, maintaining its position as a leader in systematic trend-following. With a CAGR of 17.9%, a Sharpe ratio of 1.15, and a Sortino ratio of 2.64, it continues to demonstrate superior risk-adjusted returns. SG Trend Index – Recorded a modest 0.2% gain for January, reflecting slower momentum. Its CAGR of 7.6% since January 2020 remains respectable, though it trails top-performing benchmarks. Barclay BTOP50 Index – Posted a 1.2% increase in January, bringing its 12 month return to 5.5%. It had the lowest maximum drawdown (8.7%), making it a relatively conservative performer. TTU Trend Following Index – Delivered a 1.4% gain in January, keeping pace with its peers. Its MAR ratio of 0.52 suggests a reasonable balance between returns and drawdowns. IASG TF Index – Increased by 1.3% in January, supported by strong diversification across asset classes. It maintains a Sharpe ratio of 0.54 and a Sortino ratio of 0.35. Eurekahedge TF Index – Up 0.9% in January, bringing its 12-month return to 4.8%. Systematic Momentum CTA Index – Recorded a 0.9% gain, bringing its 12 month return to 2.8%. While not a top performer, it remains a useful benchmark for evaluating pure momentum strategies. Performance Snapshot The VAMI chart underscores the sustained outperformance of the Classic Trend Index, which continues to reach new highs. Its cumulative return of 131.2% since January 2020 is unmatched, demonstrating the power of traditional trend-following strategies in navigating dynamic markets. Statistical Table The Classic Trend Index remains the top performer, boasting a CAGR of 17.9% and demonstrating resilience with a Sharpe ratio of 1.15 and a Sortino ratio of 2.64. Its ability to capture market outliers while maintaining efficient risk-adjusted returns reinforces its leadership in systematic trend-following strategies. The Barclay BTOP50 Index, while more conservative, recorded the lowest maximum drawdown (8.7%), highlighting its focus on risk mitigation. Meanwhile, the SG Trend Index and TTU Trend Following Index continue to provide steady, diversified exposure, with their CAGR of 7.6% and 6.7%, respectively. While the Eurekahedge TF Index and IASG TF Index demonstrated solid 12-month returns of 4.8% and 5.3%, they remain slightly behind the Classic Trend Index in overall performance. The Systematic Momentum CTA Index, which purely tracks momentum strategies, lags behind with a 12-month return of 2.8% but serves as a useful benchmark for evaluating trend-based momentum models. This table underscores the performance dispersion across different trend-following strategies, with outlier capture and disciplined execution continuing to separate top-performing indexes from the rest. January 2025 reinforced the dominance of the Classic Trend Index, which continues to set the standard for systematic trend-following performance. With a strong 3.7% gain for the month and a 12-month return of 19.2%, it remains the benchmark for disciplined trend-following strategies, leveraging outlier capture and robust risk management. While other indexes showed steady but varied performance, Barclay BTOP50 stood out for its low drawdowns, while IASG TF Index and Eurekahedge TF Index delivered respectable risk-adjusted returns. The Systematic Momentum CTA Index, despite its weaker 12-month return of 2.8%, continues to serve as an important reference for momentum-driven strategies. As we move deeper into 2025, the divergence in performance highlights the importance of strategy robustness and adaptability in evolving market conditions. The Classic Trend Index’s adherence to traditional trend-following principles remains its key strength, proving that disciplined execution and process-driven investing continue to drive long-term success. About the Indexes SG Trend IndexCreated by Société Générale, the SG Trend Index represents the largest trend-following CTA programs, focusing on systematic strategies with significant AUM. It captures broad market movements across various assets. More on SG Trend Index Barclay BTOP50 IndexManaged by BarclayHedge, this index follows the largest investable CTAs, emphasizing diversification across major futures markets. It’s a widely referenced benchmark for managed futures. More on BTOP50 Index TTU Trend Following IndexDeveloped by Top Traders Unplugged, the TTU TF Index includes programs with a 15-year track record, emphasizing resilience through experience and diversification across a large ensemble of programs. More on TTU TF Index SG CTA IndexAnother index by Société Générale, the SG CTA Index covers a broader array of CTA strategies, providing insight into the managed futures landscape beyond trend following alone. More on SG CTA Index IASG Trend Following IndexThis index, managed by IASG, tracks CTAs that primarily use trend-following strategies, offering a focused benchmark within the managed futures space. More on IASG TF Index Eurekahedge Trend Following IndexCurated by Eurekahedge, this index includes hedge funds specializing in trend-following across multiple asset classes, highlighting alternative approaches within trend following. More on Eurekahedge Trend Following Index Classic Trend IndexThe Classic Trend Index, curated by the Aussie Turtles, is a benchmark for traditional trend-following strategies, focusing on consistent, systematic approaches across diversified asset classes. More on Classic Trend Index Systematic Momentum CTA IndexManaged by NilssonHedge, this index tracks CTAs focused on momentum-based strategies, providing a purist view of momentum trading within managed futures. More on Systematic Momentum CTA Index Stay tuned for next month’s Battle of the Trend Following Indexes to see which benchmarks emerge as the top performers in the trend-following landscape.
Battle of the Trend Following Indexes: December 2024
Battle of the Trend Following Indexes: December 2024 In the Battle of the Trend Following Indexes, we present a monthly update on some of the most respected trend-following benchmarks. In the Battle of the Trend Following Indexes, we present a monthly update on some of the most respected trend-following benchmarks. This report includes a VAMI (Value Added Monthly Index) performance chart and a comprehensive statistical table, allowing readers to stay informed on the performance of popular trend-following indexes and identify standout performers. December 2024 Result December delivered mixed results across trend-following indexes, reflecting diverse market environments. The Classic Trend Index continued to shine, closing the year as the standout performer for 2024. Its traditional trend-following principles, focused on robust risk management and outlier capture, propelled it to outperform its peers significantly. Performance Highlights Classic Trend Index: With a 0.8% return for December and a stellar YTD performance of 18.8%, the Classic Trend Index remains the benchmark for consistent and superior risk-adjusted returns. Its MAR ratio of 1.98 and Sharpe ratio of 0.70 further highlight its efficient use of risk. SG Trend Index: December’s 1.5% gain contributed to a 2.6% YTD return, reflecting stability but lagging behind the top performers. A CAGR of 7.7% since January 2020 remains respectable for this broad-based index. Barclay BTOP50 Index: Delivered a 1.2% gain in December, bringing its YTD return to 4.4%. While solid, it underperformed compared to the Classic Trend Index. TTU Trend Following Index: Recorded a 0.9% gain in December, resulting in a YTD return of 4.4%. Its lower MAR ratio of 0.51 suggests higher relative drawdowns. IASG TF Index: With a 1.7% gain in December and a YTD return of 6.5%, this index showed resilience, supported by notable contributions from diversified asset classes. Eurekahedge TF Index: Posted a 1.7% gain in December, contributing to an impressive YTD return of 16.4%. Its Sharpe ratio of 0.68 and Sortino ratio of 1.52 reflect its focus on risk-adjusted performance. Systematic Momentum CTA Index: Achieved a 0.4% return in December, bringing its YTD return to 2.5%. While lagging behind, it provides a purist view of momentum-focused strategies. Performance Snapshot The VAMI chart showcases the Classic Trend Index’s sustained outperformance, reaching new highs despite the challenging environments faced by its peers. Its cumulative return since January 2020 remains unmatched, underscoring the strength of its systematic and diversified approach to trend following. Statistical Table The Classic Trend Index stands out as the top performer, boasting a 17.3% CAGR and minimal drawdowns, cementing its reputation for superior risk-adjusted returns. Its consistent success is rooted in its adherence to traditional trend-following principles, which emphasize systematic strategies without reliance on volatility adjustments or dynamic position sizing. By maintaining a steadfast focus on capturing market outliers, the Classic Trend Index has demonstrated resilience and efficiency, outperforming peers and setting the standard for effective trend-following methodologies. December concluded a strong year for the Classic Trend Index, solidifying its place as the benchmark for excellence in trend-following strategies. Its ability to consistently capture market outliers while minimizing risk highlights the enduring value of traditional systematic approaches. As we enter 2025, the Classic Trend Index sets a high standard for the trend-following landscape, proving that discipline and adherence to proven methodologies remain key drivers of success in an ever-changing market environment. About the Indexes SG Trend IndexCreated by Société Générale, the SG Trend Index represents the largest trend-following CTA programs, focusing on systematic strategies with significant AUM. It captures broad market movements across various assets. More on SG Trend Index Barclay BTOP50 IndexManaged by BarclayHedge, this index follows the largest investable CTAs, emphasizing diversification across major futures markets. It’s a widely referenced benchmark for managed futures. More on BTOP50 Index TTU Trend Following IndexDeveloped by Top Traders Unplugged, the TTU TF Index includes programs with a 15-year track record, emphasizing resilience through experience and diversification across a large ensemble of programs. More on TTU TF Index SG CTA IndexAnother index by Société Générale, the SG CTA Index covers a broader array of CTA strategies, providing insight into the managed futures landscape beyond trend following alone. More on SG CTA Index IASG Trend Following IndexThis index, managed by IASG, tracks CTAs that primarily use trend-following strategies, offering a focused benchmark within the managed futures space. More on IASG TF Index Eurekahedge Trend Following IndexCurated by Eurekahedge, this index includes hedge funds specializing in trend-following across multiple asset classes, highlighting alternative approaches within trend following. More on Eurekahedge Trend Following Index Classic Trend IndexThe Classic Trend Index, curated by the Aussie Turtles, is a benchmark for traditional trend-following strategies, focusing on consistent, systematic approaches across diversified asset classes. More on Classic Trend Index Systematic Momentum CTA IndexManaged by NilssonHedge, this index tracks CTAs focused on momentum-based strategies, providing a purist view of momentum trading within managed futures. More on Systematic Momentum CTA Index Stay tuned for next month’s Battle of the Trend Following Indexes to see which benchmarks emerge as the top performers in the trend-following landscape.
Battle of the Trend Following Indexes: November 2024
Battle of the Trend Following Indexes: November 2024 In the Battle of the Trend Following Indexes, we present a monthly update on some of the most respected trend-following benchmarks. In the Battle of the Trend Following Indexes, we present a monthly update on some of the most respected trend-following benchmarks. This report includes a VAMI (Value Added Monthly Index) performance chart and a comprehensive statistical table, allowing readers to stay informed on the performance of popular trend-following indexes and identify standout performers. November 2024 Result November saw a dramatic turnaround for trend-following strategies, rebounding strongly after October’s challenging environment. This resurgence was fuelled by pronounced trends in soft commodities, US Equities and Bitcoin, the latter gaining momentum after Trump’s public announcement of support. These favourable conditions provided a fertile backdrop for strong gains across all the indexes reviewed. The Classic Trend Index led the pack, delivering a standout 4.0% return, further cementing its position as the benchmark for consistent, risk-adjusted performance rooted in traditional trend-following principles. Performance Highlights Classic Trend Index: Once again emerged as the top performer, posting a 4.0% gain for November. Its superior MAR ratio of 2.05 highlights the efficiency of its risk-adjusted returns, significantly outpacing peers. This consistency reflects the enduring strength of its diversified systematic approach. SG Trend Index: Achieved a robust 3.3% return, benefiting from broad market participation, though its MAR ratio of 1.52 underscored slightly higher drawdowns relative to the Classic Trend Index. Barclay BTOP50 Index: Delivered a steady 2.4% return, demonstrating resilience but underperforming the leading benchmarks. IASG TF Index: Gained 3.4%, with notable contributions from soft commodities and equities, supported by a MAR ratio of 1.65. Eurekahedge TF Index: Added 3.2%, reflecting strength in alternative strategies, though variability remains higher compared to other benchmarks. Performance Snapshot The VAMI chart showcases the Classic Trend Index’s sustained outperformance, with cumulative returns rebased to January 2020. In November, the index reached a new high watermark, reflecting its ability to capture trends effectively while maintaining robust risk management. Unlike its peers, the Classic Trend Index adheres to traditional trend-following principles, avoiding volatility adjustments or dynamic position sizing methods that could dilute the impact of market outliers. The MAR ratio in the accompanying Statistical Table underscores its efficiency as a benchmark for risk-adjusted returns, delivering exceptional cumulative performance with minimal drawdowns since January 2020. While the market regime post-2020 has been particularly favourable for the Classic methodology—owing to its strict mitigation of adverse risk while capitalizing on beneficial volatility—the approach’s significant lifting power relative to its peers gives us confidence in its potential to deliver strong performance over the long term. Statistical Table Our comprehensive statistical table evaluates each index using key metrics, including monthly returns, Sharpe ratios, maximum drawdowns, and more. This data allows readers to track the performance and risk management effectiveness of each index. November’s results highlight the resilience and adaptability of traditional trend-following approaches. The Classic Trend Index, with its emphasis on systematic, diversified strategies that exploit market Outliers, continues to demonstrate why it is the preferred benchmark for trend-following excellence. As we approach year-end, it remains well-positioned to deliver a solid annual performance, outshining its peers across key metrics. About the Indexes SG Trend IndexCreated by Société Générale, the SG Trend Index represents the largest trend-following CTA programs, focusing on systematic strategies with significant AUM. It captures broad market movements across various assets. More on SG Trend Index Barclay BTOP50 IndexManaged by BarclayHedge, this index follows the largest investable CTAs, emphasizing diversification across major futures markets. It’s a widely referenced benchmark for managed futures. More on BTOP50 Index TTU Trend Following IndexDeveloped by Top Traders Unplugged, the TTU TF Index includes programs with a 15-year track record, emphasizing resilience through experience and diversification across a large ensemble of programs. More on TTU TF Index SG CTA IndexAnother index by Société Générale, the SG CTA Index covers a broader array of CTA strategies, providing insight into the managed futures landscape beyond trend following alone. More on SG CTA Index IASG Trend Following IndexThis index, managed by IASG, tracks CTAs that primarily use trend-following strategies, offering a focused benchmark within the managed futures space. More on IASG TF Index Eurekahedge Trend Following IndexCurated by Eurekahedge, this index includes hedge funds specializing in trend-following across multiple asset classes, highlighting alternative approaches within trend following. More on Eurekahedge Trend Following Index Classic Trend IndexThe Classic Trend Index, curated by the Aussie Turtles, is a benchmark for traditional trend-following strategies, focusing on consistent, systematic approaches across diversified asset classes. More on Classic Trend Index Systematic Momentum CTA IndexManaged by NilssonHedge, this index tracks CTAs focused on momentum-based strategies, providing a purist view of momentum trading within managed futures. More on Systematic Momentum CTA Index Stay tuned for next month’s Battle of the Trend Following Indexes to see which benchmarks emerge as the top performers in the trend-following landscape.